
#109 On-chain Insights by IT Tech - Week 52 Bitcoin Analysis & Highlights
Mixed Signals: Institutional Selling, Retail Speculation, and Shrinking Liquidity

Hello,
The 109th issue of On-chain Insights by IT Tech is out! I appreciate your support - over 4,300 subscribers strong! Haven’t joined yet? Now's the time to join! 👇
Table of contents:
Partnership with WymienBitcoina.pl
Crypto Weekly: Top 10 News
Bitcoin cycle analysis - on-chain metrics
Dumb money vs Smart money
Correlation between USDT and USDC market caps and Bitcoin price
Join Zoomex – Non-KYC Exchange with an Exclusive Bonus
Coinbase Premium Index Signals Institutional Sell Pressure Amid Bitcoin Pullback
Paid newsletter subscription - support content development
Newsletter issue summary and forecast
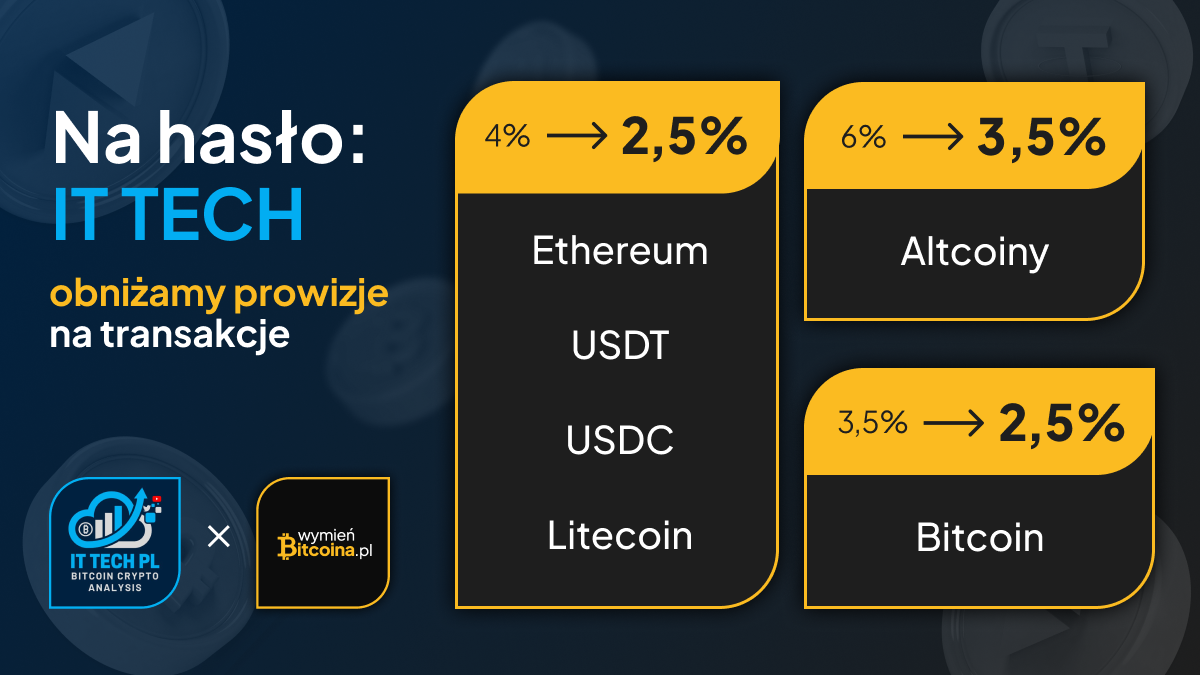
1. Partnership with WymienBitcoina.pl
I'm thrilled to collaborate with WymienBitcoina.pl, founded by Patryk Kempiński of Krypto Raport.
WymienBitcoina.pl offers a secure way to trade over 190 cryptocurrencies and access crypto-related products like wallets and books, supported by expert staff.
To make it even better, I’ve waived my commission for lower fees - use the code IT TECH for additional savings!
Follow me on X/Twitter 👉 click and subscribe to my YouTube channel 👉 click.
Find all my social media and important links in my pinned post on X/Twitter, including my Linktree. Join the discussion group linked on my profile (requests must be approved). Stay updated with alerts, liquidation levels, and more.
Get faster updates and more content on my free Telegram channels:
IT Tech Crypto - Analysis, Liquidations maps, alerts, and more.
IT Tech Crypto - comments - commentary channel for everyone, On-chain alerts, bots, reports, and more.
Unfortunately, X/Twitter has blocked the embedding of tweets on Substack, so I include screenshots of the tweets along with links to them in the description.Weekly On-Chain Dashboard - New Indicators.

Here you'll find all the essential charts for market analysis in one place. It's free for everyone. Enjoy it! 👇
2. Crypto Weekly: TOP 10 News.
1. Bitcoin ETFs Record $475M Inflow: U.S. Bitcoin ETFs saw a significant influx of $475 million, reversing the trend of recent outflows. This was driven by major investments from institutions like Fidelity, Ark, and BlackRock, signaling strong institutional interest in Bitcoin.
2. Ethereum ETFs See Major Inflows: BlackRock and Fidelity have poured about $342.2 million into Ethereum through their spot ETFs, contrasting with the outflows from Bitcoin ETFs. This indicates a shift in investor preference towards Ethereum.
3. South Korea Sanctions North Korean Hackers: South Korea has sanctioned 15 individuals and one entity linked to North Korea's Bureau 313 for stealing over $1.34 billion in cryptocurrencies. This year's global crypto thefts reached about $2.2 billion, with North Korean hackers responsible for 61%.
4. BTC and ETH Options Expiry: The expiry of options contracts worth $18 billion for Bitcoin and Ethereum led to market volatility. Bitcoin showed resilience, maintaining a price above $94,600 despite expectations of a drop to $85,000.
5. Bitcoin Price Dips: Bitcoin experienced a 4% price dip due to a TradingView 'glitch' that momentarily showed Bitcoin dominance at zero. This event, although quickly corrected, added to the week's market volatility.
6. Ethereum Shorter Gains: An Ethereum shorter made $1.1 million with 50X leverage in just two days, highlighting the market's high-risk, high-reward nature.
7. FBI and Japan Expose North Korea Hack: The FBI, along with Japan, detailed a $305 million hack by North Korean hackers on the DMM Bitcoin exchange, underscoring the ongoing threat of state-sponsored cyber attacks on crypto platforms.
8. Bitcoin 'Santa Rally': Bitcoin buyers drove the price to $98K during the week, indicating a potential 'Santa rally' as the market heads into the new year.
9. Turkey Introduces Stricter Crypto AML Regulations: Turkey has rolled out stricter Anti-Money Laundering (AML) regulations for cryptocurrencies, aiming to curb illicit activities within the crypto space.
10. Montenegro Court Approves Terraform Labs Extradition: The Montenegro court has moved forward with the extradition of Terraform Labs co-founder Do Kwon to the U.S., which could impact the legal landscape for crypto companies globally.
3. Bitcoin cycle analysis - on-chain metrics.
")
The on-chain indicators heatmap offers an innovative approach to analyzing various blockchain metrics collectively. A value approaching 1 signals that the indicator is at extreme levels, while values close to 0 indicate lower levels. Historically, BTC accumulation when the heat map shows values below 0.1 has proven to be an excellent opportunity. On the other hand, when multiple indicators approach 1, it suggests a prudent moment to consider taking profits.Based on the heatmap of Bitcoin on-chain indicators, here’s an analysis reflecting the market conditions and potential trends.
Key Insights from On-Chain Indicators: analysis of the provided Bitcoin on-chain metrics data from 2024-12-23 to 2024-12-28:
1. SOPR (Spent Output Profit Ratio, MA 90) - the SOPR (MA 90) remains consistently close to 1.0 across the dates. This indicates market neutrality, where sellers are selling at their cost basis. Such stability in SOPR usually aligns with periods of consolidation or the start of new accumulation phases.
2. Price Drawdown from ATH - the drawdown ranges from -8.7% to -12.3%, indicating that Bitcoin is trading near its all-time high levels. This relatively small drawdown suggests optimism and reflects a strong market with limited selling pressure.
3. NUPL (Net Unrealized Profit/Loss, MA 7) - the NUPL values are between 0.83 and 0.85, placing the market in the optimism/denial phase. This indicates that the majority of the market participants are in unrealized profit, with sentiment skewed toward optimism.
4. SOPR (MA 7) - SOPR (MA 7) ranges between 0.78 and 0.87, which shows consistent profit realization across the period. The gradual increase suggests that traders are locking in gains without causing significant market corrections.
5. aSOPR (Adjusted Spent Output Profit Ratio, MA 7) - aSOPR increases steadily from 0.53 to 0.59, indicating that transactions are occurring with moderate profitability. This rise implies that more participants are realizing profits, but the trend remains healthy without signs of panic selling.
6. STH SOPR (Short-Term Holder SOPR, MA 7) - STH SOPR shows a gradual increase from 0.42 to 0.46, reflecting that short-term holders are realizing modest profits. This behavior is typical of a consolidating market, where short-term participants take profits while long-term holders maintain their positions.
7. CDD (Coin Days Destroyed, MA 90) - CDD values decrease slightly from 0.73 to 0.69, suggesting reduced activity from long-term holders. This indicates that they are holding onto their Bitcoin rather than moving it to exchanges, which is a positive sign of confidence in the market.
8. MVRV (Market Value to Realized Value) - the MVRV values are in the range of 0.41 to 0.45, signaling a moderately valued market. This suggests there is room for further price appreciation, as the market is not currently overvalued.
9. MVRV Z-Score - the Z-Score remains within 0.28 to 0.31, highlighting neutral market conditions. This supports the conclusion that the market is neither overheated nor undervalued, aligning with consolidation and accumulation phases.
10. SOPR Ratio (LTH/STH) - the SOPR ratio (LTH/STH) remains low, between 0.11 and 0.13, indicating that long-term holders are realizing fewer profits compared to short-term holders. This is a positive indicator for market stability, as it shows confidence from long-term participants.
11. Fees per Transaction - Transaction fees remain stable and low, between $0.04 and $0.06. This reflects steady network activity without congestion or speculative activity spikes. Low fees are often a sign of healthy blockchain usage.
Key Observations:
1. Consolidation Phase: SOPR, MVRV, and CDD metrics suggest the market is in a consolidation phase, with no significant buying or selling pressures.
2. Profit Realization: Short-term holders are realizing profits, as indicated by the rising STH SOPR and aSOPR values. However, this is happening in a controlled manner, which prevents large corrections.
3. Long-Term Confidence: Low CDD and stable SOPR ratios indicate that long-term holders are confident and not actively selling, which supports a bullish market outlook.
Conclusions:
• Market Sentiment: Neutral to slightly bullish, with indicators pointing toward accumulation and stability.
• Short-Term Outlook: Likely continuation of consolidation with limited downside risks.
• Long-Term Outlook: Potential for upward momentum if long-term holders maintain confidence and external conditions remain favorable.
This analysis highlights a healthy market structure with optimism for further growth. Monitoring SOPR and NUPL values in the coming days will be crucial to identifying shifts in sentiment.
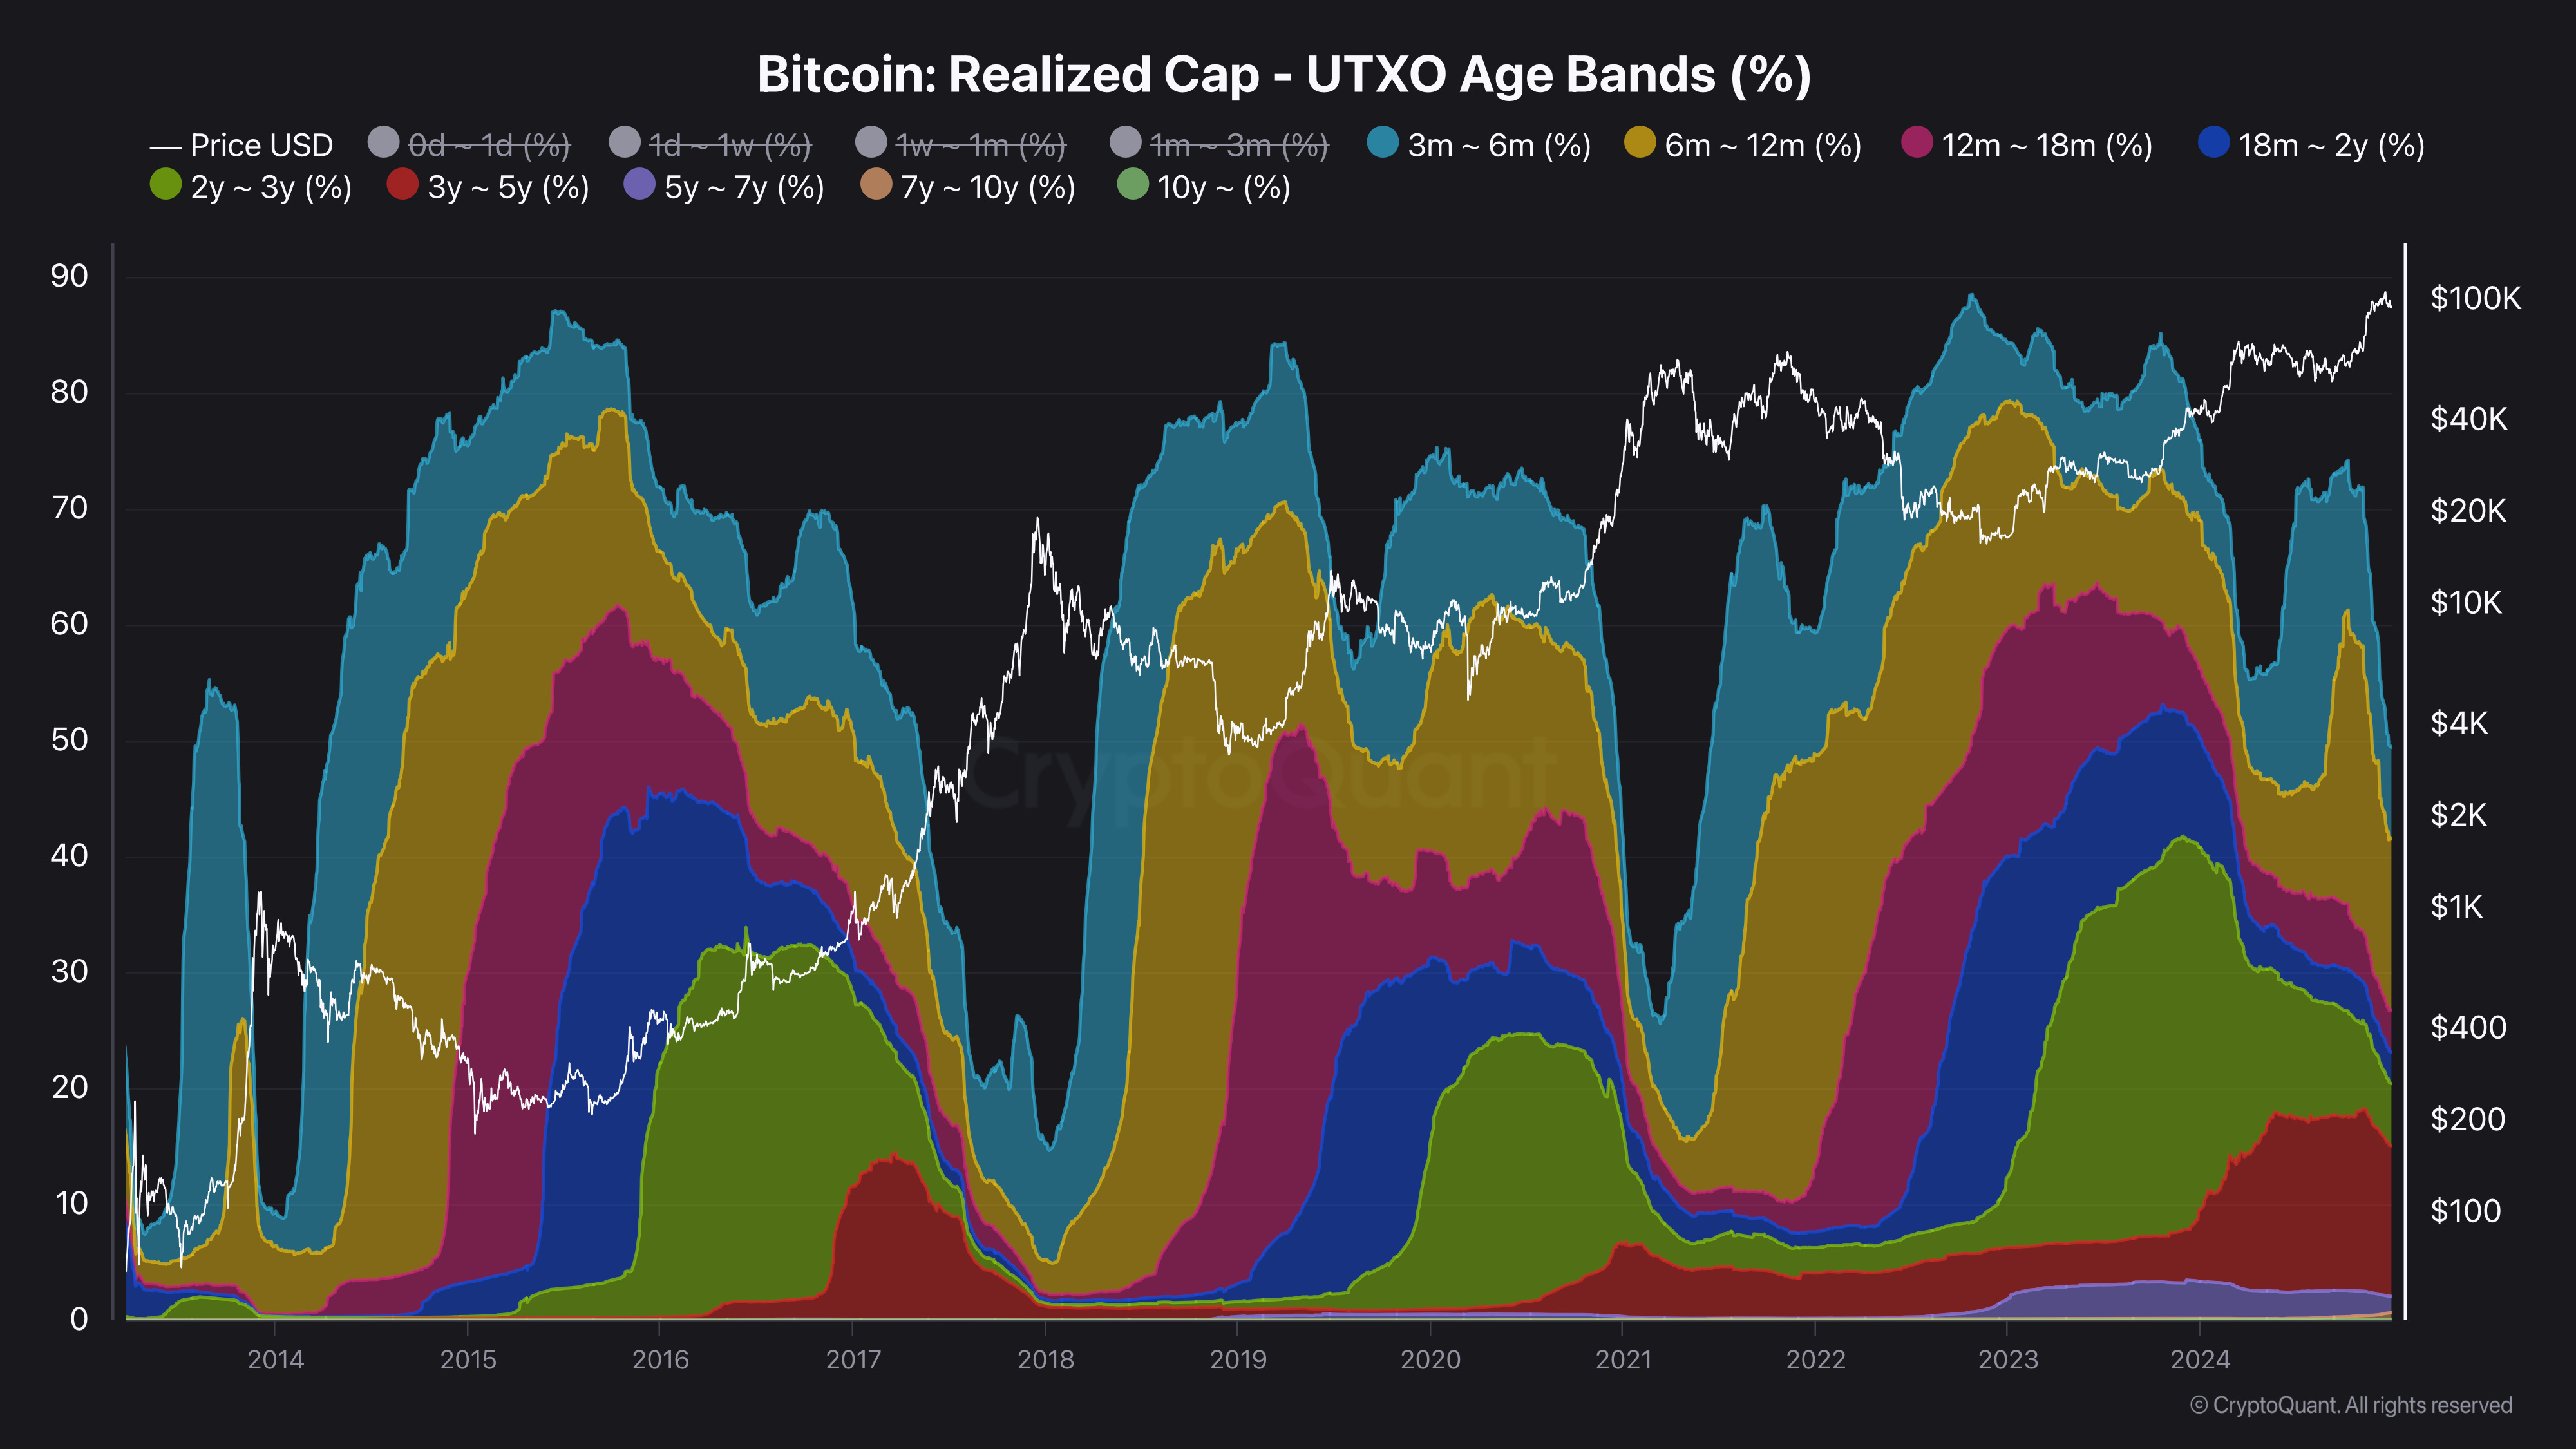
4. Dumb money vs Smart money.

Realized Cap - UTXO Age Bands shows the distribution of realized cap of a specified age band.Each colored band represents the ratio of the Realized Cap of UTXOs in existence, that were last moved within the denoted time period.
Realized Cap is calculated by valuing each UTXO by the price when it was last moved.This indicator summarizes the capitalization held by short-term holders.
The concept of “dumb money” vs. “smart money” refers to the behavior of different types of market participants in response to Bitcoin’s price fluctuations and on-chain activity:
1. Dumb Money Definition: Typically retail investors who are more reactive and emotional in their investment decisions. They often enter the market during hype phases or near local tops and panic-sell during corrections.
Behavior Past Phases: During bull markets, these investors dominate the younger UTXO age bands (e.g., 0–1 month, 1–3 months), as they buy in at higher prices. In bear markets or corrections, they often capitulate, leading to a rapid increase in short-term spent outputs.
Current Phase: If Bitcoin’s price is consolidating or rising steadily, we might see an increase in the activity of these age bands, signaling renewed retail interest and FOMO. Conversely, capitulation is marked by their dominance shrinking as they exit positions at a loss.
2. Smart Money Definition: Refers to experienced investors, institutions, or long-term holders (LTHs) who accumulate during periods of market weakness and distribute during bullish euphoria
Behavior Past Phases: During accumulation phases, smart money is represented by older UTXO age bands (e.g., >1 year). They demonstrate patience, holding onto Bitcoin while the price consolidates or drops, and they avoid selling at lower price levels.
Current Phase: Smart money’s activity is minimal during bull markets, as they wait for opportunities to offload their holdings. When Bitcoin’s price is high and retail investors dominate, these holders often distribute to capitalize on demand.
Market Implications:
1. Current Market Phase. Based on the charts:
• Younger UTXO bands (e.g., 1 day–3 months) have increased dominance in recent months, signaling heightened retail participation and FOMO-like behavior.
• Older UTXO bands remain steady, suggesting that smart money continues holding rather than distributing aggressively.
• This indicates that the market is transitioning toward a speculative phase but may not yet have reached euphoria.
2. Historical Comparisons:
• In previous bull markets, dumb money dominated near all-time highs, with older age bands (smart money) declining as they distributed coins.
• During bear markets, the dominance of younger UTXO bands shrank as retail investors capitulated, and smart money began accumulating.
Current Dynamics:
• Dumb Money Behavior: Retail investors are likely entering the market in response to recent price increases. These groups may exhibit lower conviction, increasing the probability of capitulation during corrections.
• Smart Money Behavior: Long-term holders are showing a tendency to hold, as seen by the steady levels in older UTXO bands. Their distribution activity remains low, suggesting confidence in future price growth.
Conclusion:
The current market phase appears to be transitioning from early accumulation (dominated by smart money) to a more speculative phase (increasing dumb money activity). Monitoring shifts in UTXO age bands will provide insight into whether the market is approaching a top or remains in the early stages of a bull run. In my opinion the market top isn’t in and final bull run is still ahead.
5. Correlation between USDT and USDC market caps and Bitcoin price.

Rising stablecoin market capitalization (USDT and USDC) typically correlates with increasing Bitcoin prices, indicating higher market liquidity and demand.
Conversely, declining stablecoin market capitalization often signals increased crypto selling and lower liquidity, potentially leading to Bitcoin price decreases.
USDT Market Cap Analysis (23-28 December 2024):
• Daily Market Cap Changes:
• December 23, 2024: -260.41M USD
• December 24, 2024: +268.86M USD
• December 25, 2024: -359.15M USD
• December 26, 2024: -141.78M USD
• December 27, 2024: +64.69M USD
• December 28, 2024: -563.07M USD
Net Market Cap Change:
Over the period from December 23 to December 28, 2024, USDT witnessed a net decrease of -990.86M USD in market cap, reflecting significant outflows.

USDC Market Cap Analysis (23-28 December 2024):
• Daily Market Cap Changes:
• December 23, 2024: +71.13M USD
• December 24, 2024: +88.52M USD
• December 25, 2024: +98.07M USD
• December 26, 2024: +245.2M USD
• December 27, 2024: +74.25M USD
• December 28, 2024: +26.39M USD
Net Market Cap Change: Over the same period, USDC experienced a net increase of +603.56M USD, reflecting consistent and moderate inflows.
Combined Analysis (USDT & USDC): Together, USDT and USDC saw a combined net change of -387.30M USD, driven primarily by USDT’s significant outflows despite consistent inflows into USDC.
Implications for the Market: The contrasting behavior of USDT and USDC market caps suggests investor repositioning. The large USDT outflows may indicate reduced demand for liquidity or increased conversions into fiat, while USDC inflows reflect cautious but steady market interest.
The overall net outflows could be linked to year-end market adjustments, portfolio rebalancing, or reduced speculative trading.
Conclusion:
From December 23 to December 28, 2024, the stablecoin market exhibited mixed dynamics, with USDT showing significant outflows of -990.86M USD, while USDC registered inflows of +603.56M USD. The net decline of -387.30M USD for both stablecoins suggests reduced overall liquidity in the cryptocurrency market, which may signal investor caution or market consolidation during the holiday period.
6. Join Zoomex – Non-KYC Exchange with an Exclusive Bonus
On 30 December, new MiCa regulations will take effect across the European Union, prompting many traders to seek exchanges that do not require KYC. In response, I’ve partnered with Zoomex, a cutting-edge exchange that prioritizes privacy while offering outstanding trading conditions.
Why Choose Zoomex?
1. Privacy Without KYC
Unlike Bybit and Bitget, Zoomex allows you to trade and deposit funds without KYC requirements, keeping your identity private and compliant-free under new MiCa rules.
2. Strong Foundation
Developed by a team of former Bybit employees, Zoomex combines familiarity with enhanced privacy for a seamless trading experience.
3. Superior Trading Conditions
High Liquidity: Enjoy minimal slippage, even during high-volume trades.
Diverse Trading Pairs: A broader range compared to BingX, rivaling Bybit.
VIP Perks: Accessible VIP programs with low fees, perfect for traders of all portfolio sizes.
4. Secure and Reliable
No Downtime: Unlike Binance or Bitget, Zoomex guarantees uninterrupted service.
Unmatched Security: Zero hacks to date, ensuring your funds and trades are always protected.
🚀 Exclusive Trading Bonus for My Followers!
Sign up with my exclusive link, deposit $100, and claim a 30 USDT trading bonus as part of this special collaboration!
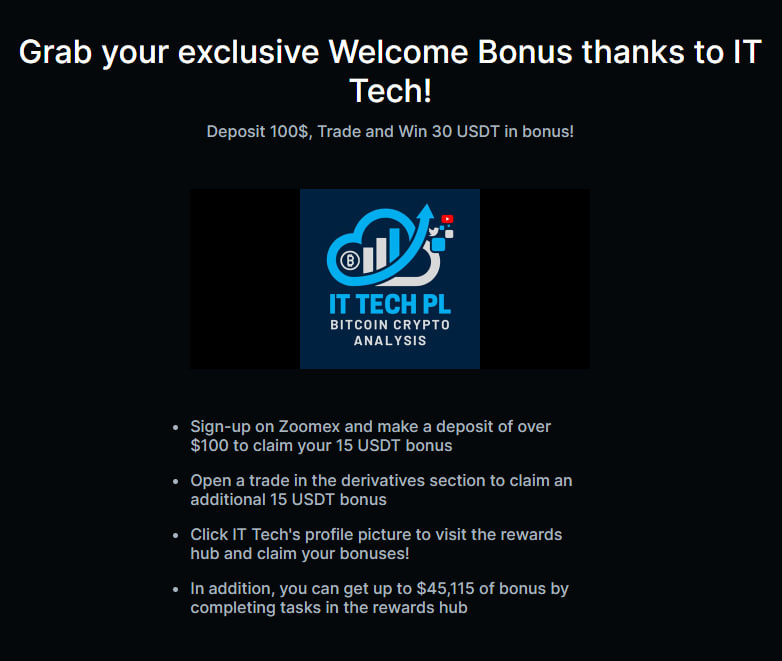
How to Claim the Trading Bonuses on Zoomex:
Sign Up on Zoomex
Use this exclusive link to create your Zoomex account.
Deposit $100 or More
Deposit at least $100 to qualify for the first bonus.
Claim Your First 15 USDT Trading Bonus
After depositing, the first 15 USDT trading bonus will be available in your rewards hub.
Trade in the Derivatives Section
Open a trade in the derivatives market to qualify for the second part of the bonus.
Claim Your Second 15 USDT Trading Bonus
Once your trade is completed, visit the rewards hub to claim the additional 15 USDT bonus.
Explore Additional Bonuses
Check out Zoomex's rewards hub for tasks to earn up to $45,115 in trading bonuses.
7. Coinbase Premium Index Signals Institutional Sell Pressure Amid Bitcoin Pullback.

The Coinbase Premium Index measures the price difference between Coinbase Pro (USD pair) and Binance (USDT pair).Key Observations:
1. Positive Premium (Green Zones): Periods where the Coinbase price is higher than global averages indicate strong institutional demand or significant buying pressure from U.S.-based traders.
Noticeable spikes in the green zones align with Bitcoin’s price increases, particularly during late October and early November when Bitcoin rallied above $100K.
2. Negative Premium (Red Zones): Periods where the Coinbase price is lower than global averages often suggest reduced institutional demand or selling pressure within the U.S. market.
Extended red zones during September and December align with Bitcoin’s price corrections, signaling potential profit-taking or reduced U.S. market activity.
3. Shift in Sentiment: the transition from negative to positive premium in mid-October corresponds to the breakout above $85K, reinforcing the impact of institutional participation during bullish phases.
The re-emergence of red zones in December coincides with Bitcoin’s consolidation below $95K, hinting at profit realization or cautious positioning by institutional players.
Conclusion:
The Coinbase Premium Index highlights the significant role of U.S. institutional players in shaping Bitcoin’s price movements. The pronounced positive premium during Bitcoin’s rise underscores robust institutional demand, whereas the negative premium in December signals caution, coinciding with market consolidation near $95K. Future shifts in the Coinbase Premium Index will remain a critical indicator for gauging institutional sentiment and potential price direction.
8. Paid Newsletter Subscription – Support Content Development.
I’ve launched a paid subscription for my newsletter, starting at just $5 per month. By subscribing, you’ll receive:
Exclusive Content – Additional charts from premium platforms like CryptoQuant, Kingfisher, Santiment, and Intotheblock, available on request.
Telegram Subscribers' Group – Ask me any crypto-related questions directly.
Educational Content – Learn more about on-chain analysis.
Early Access – Get the newsletter immediately after it’s written, no waiting until 6 PM.
Enjoy a 5% discount coupon for an annual subscription below. Thank you to everyone supporting my work!
If you'd like to treat me to a virtual coffee or beer as a one-time gesture, you can do so through Suppi.
9. Newsletter Issue Summary:
Crypto Weekly: Top 10 News: Key developments include Bitcoin ETF inflows, Ethereum growth, North Korean crypto thefts, MiCA regulations, and Bitcoin’s Santa rally.
Bitcoin Cycle Analysis: On-chain metrics indicate consolidation with neutral-to-bullish sentiment; short-term holders profit while long-term holders maintain confidence.
Dumb Money vs. Smart Money: Retail investors (“dumb money”) show increased activity, signaling heightened speculation, while long-term holders (“smart money”) remain steady and realize profits.
Stablecoin Market Cap and Bitcoin Correlation: USDT outflows of -990M USD contrast with USDC inflows of +603M USD, reflecting mixed market liquidity signals.
Coinbase Premium Index Analysis: Negative premium highlights bearish institutional sentiment, coinciding with Bitcoin’s pullback and profit-taking.
Forecast for the Upcoming Week:
Market Sentiment: Bitcoin is expected to consolidate near current levels as liquidity inflows stabilize and institutional sentiment remains cautious.
Altcoin Market: Continued outflows from altcoins, with potential rotation back into Bitcoin as a safer store of value.
Institutional Signals: Monitor Coinbase Premium Index for signs of renewed buying interest, indicating possible recovery.
Stablecoin Trends: USDC inflows suggest cautious accumulation, while significant USDT outflows may reflect reduced liquidity.
Economic Events: Watch for macroeconomic developments in the U.S. and EU, as they could influence crypto market movements.
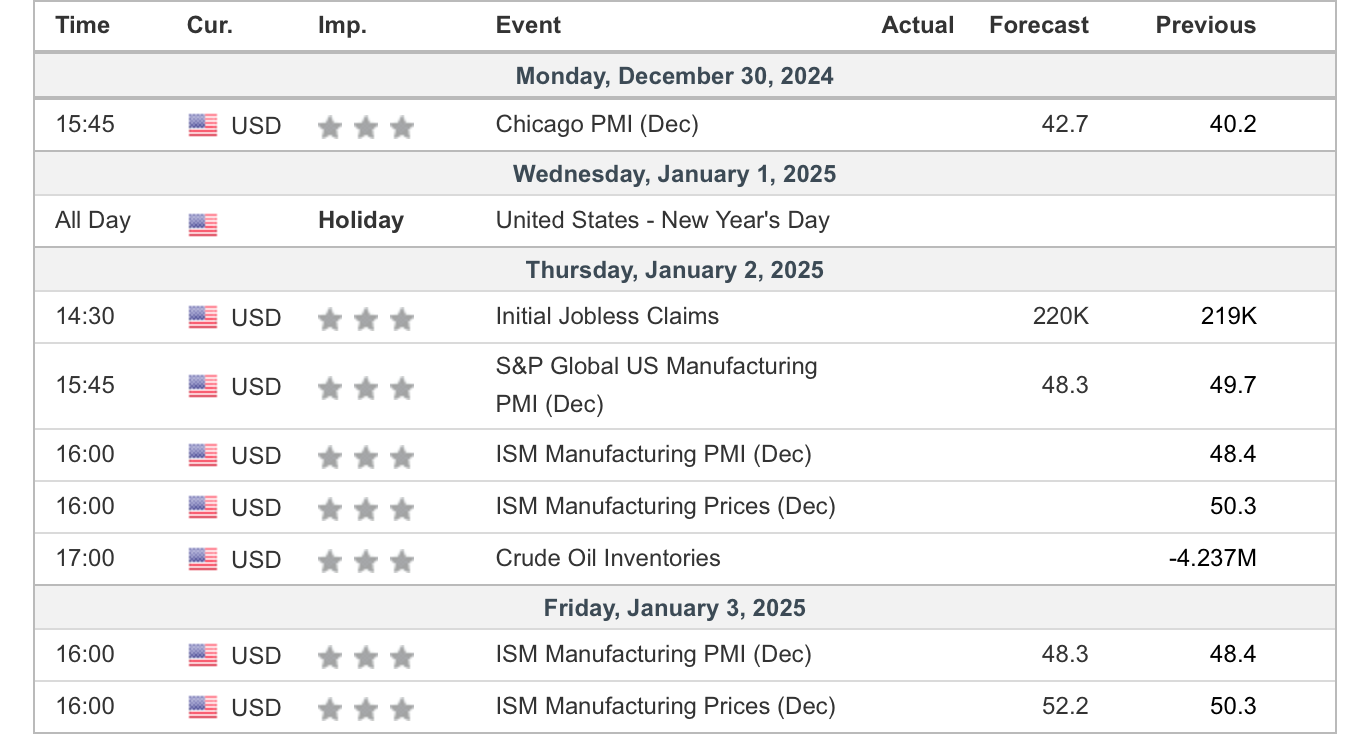
Stay alert and monitor key indicators for better market insights. Track upcoming US and EU events for free using the Economic Calendar
Remember to realize profits regularly.💡
This concludes this issue. I hope you have a pleasant end to your weekend and a great week ahead. Happy New Year 2025!

If you found this article helpful, leave a like 💙 comment and share it on your social media. 🤝
The next issue arrives next Sunday at 6 p.m. - check your inbox and SPAM folder!
This article reflects my personal views and is not investment advice. Cryptocurrency investments carry high risk. It includes mentions of WymienBitcoina.pl and affiliate links that may benefit the author.
Best regards
IT Tech