


#113 On-chain Insights by IT Tech - Week 4 Bitcoin Analysis & Highlights
Bitcoin Below $100K – Market Shakeout or Buying Opportunity?

Hello,
The 113th issue of On-chain Insights by IT Tech is out! I appreciate your support - over 4,400 subscribers strong! Haven’t joined yet? Now's the time to join! 👇
Table of contents:
Partnership with WymienBitcoina.pl
Current market situation
Coinbase Premium Index Analysis – Institutional Sentiment Turns Bearish
Correlation between USDT and USDC market caps and Bitcoin price
Bitcoin Leaving Exchanges – Is a Supply Shock Inevitable?
Bitcoin’s Correction: Buying Opportunity or Warning Sign?
Paid newsletter subscription - support content development
Newsletter issue summary and forecast
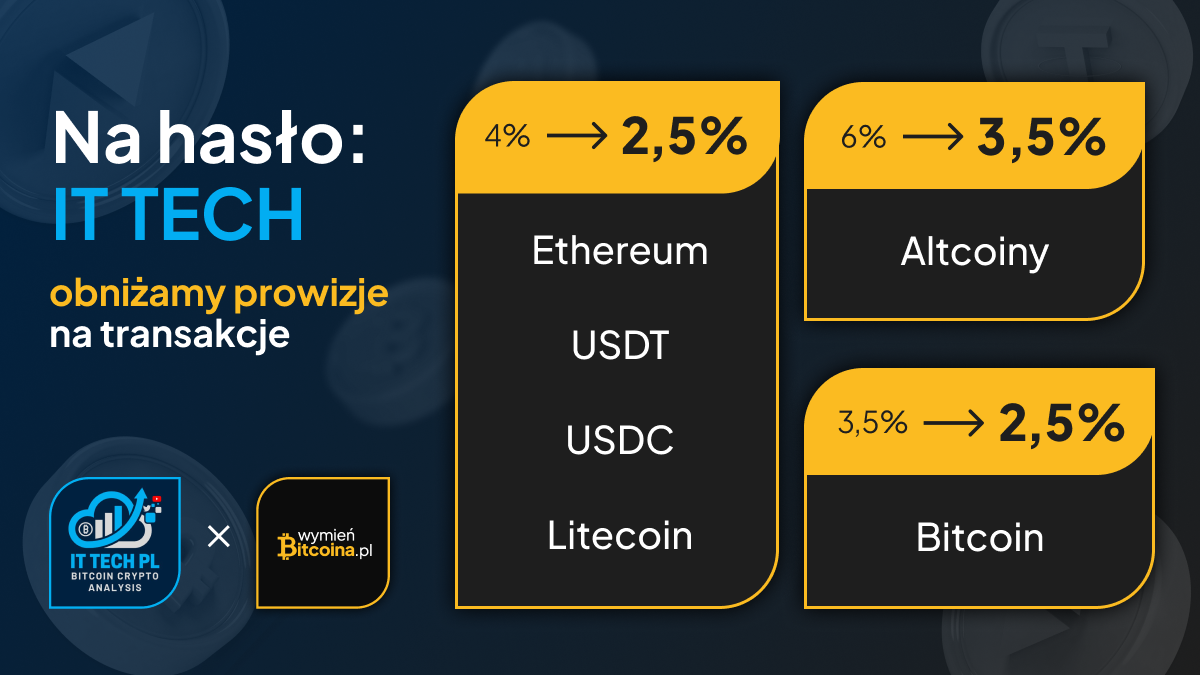
1. Partnership with WymienBitcoina.pl
I'm thrilled to collaborate with WymienBitcoina.pl, founded by Patryk Kempiński of Krypto Raport.
WymienBitcoina.pl offers a secure way to trade over 190 cryptocurrencies and access crypto-related products like wallets and books, supported by expert staff.
To make it even better, I’ve waived my commission for lower fees - use the code IT TECH for additional savings!
Follow me on X/Twitter 👉 click and subscribe to my YouTube channel 👉 click.
Find all my social media and important links in my pinned post on X/Twitter, including my Linktree. Join the discussion group linked on my profile (requests must be approved). Stay updated with alerts, liquidation levels, and more.

Get faster updates and more content on my free Telegram channels:
IT Tech Crypto - Analysis, Liquidations maps, alerts, and more.
IT Tech Crypto - comments - commentary channel for everyone, On-chain alerts, bots, reports, and more.
Unfortunately, X/Twitter has blocked the embedding of tweets on Substack, so I include screenshots of the tweets along with links to them in the description.Weekly On-Chain Dashboard - New Indicators.

Here you'll find all the essential charts for market analysis in one place. It's free for everyone. Enjoy it! 👇
2. Current market situation.

Market Overview:
1. Bitcoin (BTC) Drops Below $100K: BTC is trading at $99,571 (-4.83%), marking a sharp decline. Psychological support at $100K has been breached, potentially triggering more downside.
2. Ethereum (ETH) Shows Even Greater Weakness: ETH is down 5.85%, currently trading at $3,106. This suggests altcoins are facing stronger selling pressure compared to Bitcoin.
3. Altcoins in a Bloodbath: The majority of altcoins are deep in the red, with losses exceeding 10-15% for many projects. Examples: PEPE: -10.80%, SOL: -7.76%, SHIB: -12.46%, DOGE: -14.26%
4. Stablecoins and Select Assets Show Some Resilience: Some assets (like USDT, USDC, and other stablecoins) are neutral or slightly positive, reflecting capital rotation into safer assets. XMR (Monero) and a few low-cap assets show green, meaning some investors are hedging into privacy coins and stable assets.
Interpretation:
Heavy Liquidations & Risk-Off Sentiment: The widespread declines indicate a risk-off environment, possibly fueled by macro concerns, institutional selling, or liquidation cascades.
Bitcoin Leading the Drop: The break below $100K might trigger further volatility if buyers don’t step in quickly.
Stablecoins See Inflows: This suggests that capital is moving to safety, rather than exiting crypto entirely.
Watch for Reversal Signals: If Bitcoin stabilizes above $ 98K-$100K, we may see a relief bounce. Otherwise, further downside pressure remains likely.
3. Coinbase Premium Index Analysis – Institutional Sentiment Turns Bearish.

The Coinbase Premium Index measures the price difference between Coinbase Pro (USD pair) and Binance (USDT pair). High premium values may indicate strong buying pressure from U.S. investors on Coinbase.Coinbase Premium Index Analysis – Institutional Sentiment Turns Bearish
Key Observations:
Sustained Negative Premium: The Coinbase Premium Index remains in negative territory, indicating that Bitcoin is trading at a discount on Coinbase compared to Binance. This suggests weaker demand from U.S. institutions, which historically play a crucial role in market trends.
2. Short-lived positive Premiums: There were brief moments of positive premium around January 24 and January 30, aligning with short-term Bitcoin price spikes. However, these were quickly reversed, showing that institutional demand did not sustain the rally.
3. Correlation with Bitcoin’s Price Drop: The most recent Bitcoin decline below $100K coincides with a deeper negative premium on Coinbase. This reinforces the idea that institutional selling pressure is mounting.
Market Implications:
The prolonged negative premium suggests that U.S. institutions are either selling into strength or staying on the sidelines.
Historically, a sustained positive premium has signaled bullish sentiment for Bitcoin, whereas negative premiums suggest institutional hesitation or profit-taking.
f this trend continues, Bitcoin may face further downside unless institutional buyers step back in to provide stronger demand.
Conclusion:
The weakening institutional demand signals caution for the broader market. The inability of Bitcoin to maintain above $100K, coupled with sustained negative premiums, suggests potential for further downside or consolidation in the short term. Traders should monitor the Coinbase Premium Index closely—a shift into positive territory could signal renewed institutional interest and a potential rebound.
4. Correlation between USDT and USDC market caps and Bitcoin price.

Rising stablecoin market capitalization (USDT and USDC) typically correlates with increasing Bitcoin prices, indicating higher market liquidity and demand.
Conversely, declining stablecoin market capitalization often signals increased crypto selling and lower liquidity, potentially leading to Bitcoin price decreases.
USDT Daily Market Cap Change (in million USD) 27 Jan 2025 - 1 Feb 2025):
• 2025-01-27: +39.58M USD
• 2025-01-28: +58.53M USD
• 2025-01-29: +91.88M USD
• 2025-01-30: -51.18M USD
• 2025-01-31: -57.12M USD
• 2025-02-01: +8.23M USD
Net USDT Market Cap Change (27 Jan 2025 - 1 Feb 2025): +89.92M USD
Conclusion:
The USDT market cap changes over the past six days indicate wavering trader confidence. While the net inflow remains positive, the mid-week outflows highlight a cautious market approach. As Bitcoin’s price faces pressure, monitoring USDT flows could provide early insights into market sentiment shifts and potential price movements.

USDC Daily Market Cap Change (in million USD): (27 Jan 2025 - 1 Feb 2025)
• 2025-01-27: +44.78M USD
• 2025-01-28: +260.20M USD
• 2025-01-29: +32.02M USD
• 2025-01-30: +566.77M USD
• 2025-01-31: +204.26M USD
• 2025-02-01: +1.81M USD
Net USDC Market Cap Change (27 Jan 2025 - 1 Feb 2025): +1.11B USD
Conclusion:
The USDC market cap grew significantly (+1.11B USD) over the past six days, but inflows have weakened toward the end of the period. While this initially suggested strong liquidity entering the market, the lack of a corresponding Bitcoin price surge raises questions about capital deployment. Traders should monitor whether this liquidity translates into new market entries or remains sidelined, as it could determine Bitcoin’s next move in the coming days.
Combined Net Market Cap Change for USDT & USDC (27 Jan 2025 - 1 Feb 2025)
📊 Total Net Change: +1.20B USD
Key Takeaways:
USDC was the dominant contributor to stablecoin supply growth, adding +1.11B USD, while USDT inflows were much smaller at +89.92M USD.
Stablecoin supply increased by over $1.2B in just six days, suggesting that liquidity is entering the crypto market.
Bitcoin price fell from $105K to $99K, despite the stablecoin inflows, indicating that liquidity has not yet fully deployed into BTC.
USDC inflows peaked on Jan 30 (+566.77M USD), while USDT saw fluctuations with two negative days, hinting at shifting market preferences between stablecoins.
Market Implications:
The increase in USDC supply suggests that institutional and large traders are positioning capital, potentially waiting for an entry point rather than aggressively deploying funds into BTC.
USDT’s inconsistent flows could indicate rotation into other assets or capital outflows, which may impact overall market liquidity.
If stablecoin supply continues growing, it could support Bitcoin’s next leg up, but the slowing USDT inflows could be a short-term concern.
Conclusion:
The net increase of +1.20B USD in stablecoins suggests strong liquidity inflows into the crypto ecosystem, but Bitcoin has yet to reflect this in price action. If this liquidity is eventually deployed into BTC, it could provide bullish momentum. However, the diverging behavior of USDT and USDC indicates that investors may be waiting for a better opportunity before deploying capital. Traders should watch for further stablecoin inflows and their potential impact on BTC price movements in the coming days.
5. Bitcoin Leaving Exchanges – Is a Supply Shock Inevitable?

1. Declining Exchange Balances, But Not a Supply Shock
Bitcoin balances on exchanges have dropped from 3.1M BTC in July 2024 to 2.7M BTC today.
While this is often interpreted as a supply shock from investor withdrawals, most of this decline is due to BTC moving into ETF custodian wallets—primarily Coinbase

US Spot ETF Balances (glassnode)

2. Institutional Demand Driving BTC Movements
Since the SEC approved Bitcoin Spot ETFs, 8 out of 11 ETFs chose Coinbase as their custodian.
As demand surged, BTC migrated from exchange wallets to institutional custody, impacting exchange balance readings.

Bitcoin: Balance on Exchanges & ETFs (glassnode)

3. Total Market Structure Shift, Not Reduced Supply
Adjusting for non-Coinbase ETFs (such as FBTC, HODL), total BTC held across exchanges + ETF wallets remains around 3M BTC, which is similar to January 2024 levels.
This means the drop in exchange balances does not necessarily indicate reduced supply, but rather a reallocation of holdings to ETFs
Market Implications
📌 Less BTC on exchanges could reduce immediate sell pressure, but given ETFs’ ability to allow redemptions, this liquidity is not entirely locked up.
📌 Institutional accumulation continues as ETF holdings grow, currently at 1.69M BTC as of January 29, 2025.
📌 Coinbase’s role as the dominant custodian makes its internal wallet flows more significant for understanding BTC liquidity.
Conclusion:
The movement of BTC from exchanges into ETF custodians signals a fundamental shift in market structure rather than a traditional supply shock. While this could support long-term price appreciation, it also means ETF flow dynamics will increasingly dictate Bitcoin’s price movements. Monitoring ETF inflows/outflows will be critical for assessing market liquidity and potential price trends in the coming months.
6. Bitcoin’s Correction: Buying Opportunity or Warning Sign?

BTC Drawdown Analysis – Key Takeaways
Minimal Drawdowns Signal Market Strength – The chart shows that recent Bitcoin price drawdowns have been shallow, indicating strong buy-side support.
Current Correction Within Healthy Ranges – Historically, BTC has seen much deeper corrections (-15% to -20%) in past cycles. The latest pullback remains mild compared to these levels.
Bullish Structure Intact – The price remains in an uptrend, and previous drawdowns have been followed by renewed strength. As long as corrections stay above key support levels, momentum remains positive.
Volatility Expected – The market could experience occasional sharp drawdowns, but overall, BTC continues to show resilience.
Conclusion:
Bitcoin is in a strong market phase, with price corrections staying within historical norms. Traders should watch for deeper dips but recognize that moderate drawdowns are a natural part of long-term uptrends.

Bitcoin Support & Resistance Levels - Key Insights
📊 Current BTC Price: $99K
🔹 365-Day SMA: $71.1K
🔹 Realized Price: $42.7K
🔹 STH (Short-Term Holder) Realized Price: $90.1K
🔹 STH 1W-1M Realized Price: $100.4K
🔹 STH 1M-3M Realized Price: $96.4K
🔹 STH 3M-6M Realized Price: $62.7K
Key Takeaways:
BTC Testing Short-Term Holders’ Realized Price – The price is hovering around the STH 1W-1M realized price ($100.4K). A break above could signal strength, while rejection may indicate short-term resistance.
Critical Support at $90K – The broader STH realized price ($90.1K) is a crucial level. If BTC retraces, this could act as strong support before any further downside.
Long-Term Holder Confidence Remains Strong – The 365-day SMA and overall realized price remain far below the current market value, suggesting that long-term holders remain in profit and aren’t capitulating.
Potential for Further Upside – As long as BTC holds above the $90K-$96K range, bulls remain in control. A reclaim of $105K could trigger renewed momentum.
Conclusion:
Bitcoin is at a pivotal level, testing short-term holders’ realized price. If BTC can back above $100K and establish it as support, it may fuel another leg higher. However, a failure to hold this level could lead to a test of lower supports near $90K.

Bitcoin Taker Buy Sell Ratio – A Potential Shift in Market Sentiment?
📊 Current BTC Price: $98.8K
🔹 Taker Buy/Sell Ratio: Dropping Below 0.93
🔹 30-Day SMA: Trending Lower
Key Observations:
Taker Buy/Sell Ratio Below 0.93 – Historically, values below this threshold indicate increased selling pressure from aggressive takers, often preceding periods of market weakness or corrections.
Repeated Weak Readings – Over the past few weeks, multiple occurrences of low taker buy/sell ratios suggest sustained sell-side dominance, potentially signaling exhaustion of bullish momentum.
Price Holding Near $100K Support – Despite the selling pressure, BTC has maintained levels close to $100K, which suggests that buy-side interest still exists at key support levels.
Comparison to Previous Corrections – Similar dips in the taker buy/sell ratio previously aligned with local price retracements. If history repeats, Bitcoin could see additional short-term downside before finding a stronger support level.
Conclusion:
The declining taker buy/sell ratio indicates growing selling pressure, which could lead to short-term volatility or consolidation. However, if BTC manages to hold above key levels ($98K-$100K), it could indicate that demand is absorbing the current selling activity.
7. Paid Newsletter Subscription – Support Content Development.
I’ve launched a paid subscription for my newsletter, starting at just $5 per month. By subscribing, you’ll receive:
Exclusive Content – Additional charts from premium platforms like CryptoQuant, Kingfisher, Santiment, and Intotheblock, available on request.
Telegram Subscribers' Group – Ask me any crypto-related questions directly.
Educational Content – Learn more about on-chain analysis.
Early Access – Get the newsletter immediately after it’s written, no waiting until 6 PM.
Enjoy a 5% discount coupon for an annual subscription below. Thank you to everyone supporting my work!
If you'd like to treat me to a virtual coffee or beer as a one-time gesture, you can do so through Suppi.
8. Newsletter Issue Summary:
1. Market Overview: BTC Drops Below $100K: Bitcoin breaks below the psychological $100K level (-4.83%), triggering market-wide selling. Altcoins face heavy losses, with ETH down 5.85% and several assets losing over 10-15%. Stablecoins and privacy coins like XMR show resilience, indicating capital rotation. Buyers need to step in soon to prevent further downside pressure.
2. Coinbase Premium Index: Institutional Sentiment Turns Bearish: The Coinbase Premium Index remains negative, indicating weak institutional demand. Brief positive premiums were short-lived, aligning with failed BTC rallies. A deeper negative premium accompanied Bitcoin’s drop below $100K, signaling continued institutional selling. A shift back to a positive premium would indicate renewed institutional interest.
3. Stablecoin Market Cap Trends: USDT and USDC combined saw a net increase of +1.20B USD in the past six days. Despite stablecoin inflows, Bitcoin’s price declined, suggesting liquidity isn’t yet entering BTC. USDC saw stronger inflows than USDT, hinting at potential positioning by institutional players. If stablecoin supply continues growing, Bitcoin may see renewed bullish momentum.
4. Bitcoin Exchange Balances – Supply Shock or Structural Shift? Exchange BTC balances fell from 3.1M BTC (July 2024) to 2.7M BTC but largely due to ETF custody. 8 out of 11 Spot Bitcoin ETFs chose Coinbase as their custodian, shifting liquidity from exchanges. Adjusting for ETF holdings, total BTC in circulation remains near 3M BTC, reducing the risk of an imminent supply shock. ETF flows will increasingly dictate Bitcoin’s liquidity trends.
5. Bitcoin’s Correction: Buying Opportunity or Warning Sign? Recent drawdowns remain mild, historically corrections have been -15% to -20%. Short-Term Holders’ (STH) realized price is at $100.4K, acting as a key pivot level. If BTC holds above $90K-$96K, bulls maintain control; a break below could trigger deeper losses. Volatility is expected, but BTC’s long-term structure remains bullish.
6. Taker Buy/Sell Ratio – A Warning for Bulls? The Taker Buy/Sell Ratio dropped below 0.93, indicating increased sell pressure. Multiple occurrences of this low ratio suggest sustained market weakness. Bitcoin holding near $98K-$100K support despite selling shows buy-side interest. If BTC maintains this range, demand absorption could prevent further declines.
Forecast for the Upcoming Week:
1. Bitcoin’s $100K Retest – Make or Break? BTC is currently testing $100K support, and a sustained recovery above this level is key for bullish momentum. Failure to reclaim $100K may lead to a retest of $90K support.
2. Institutional Selling Pressure to Watch. The Coinbase Premium Index remains negative, suggesting institutions are not aggressively buying. If this trend continues, further consolidation or downside is possible.
3. Stablecoin Supply Increases, But Will It Flow Into BTC? USDT and USDC inflows remain strong (+1.2B USD in 6 days), but Bitcoin has yet to benefit. If liquidity shifts into BTC, we could see renewed upside momentum.
4. ETF Inflows vs. Exchange Withdrawals – Impact on Price. More BTC is leaving exchanges and entering ETFs, shifting liquidity to institutional hands. ETF demand needs to remain strong to prevent downward pressure.
5. Short-Term Holder Price Levels Critical
• STH Realized Price (1W-1M): $100.4K – reclaiming this level is bullish.
• STH Realized Price (1M-3M): $96.4K – holding this level keeps the structure intact.
Stay alert and monitor key indicators for better market insights. Track upcoming US events for free using the Economic Calendar.

Remember to realize profits regularly.💡
This concludes this issue. I hope you have a pleasant end to your weekend and a great week ahead.
If you found this article helpful, leave a like 💙 comment and share it on your social media. 🤝
The next issue arrives next Sunday at 6 p.m. - check your inbox and SPAM folder!
This article reflects my personal views and is not investment advice. Cryptocurrency investments carry high risk. It includes mentions of WymienBitcoina.pl and affiliate links that may benefit the author.
Best regards
IT Tech