
Bitcoin and Crypto Market Report - Week 1 #160
What Big Wallets Are Doing as Price Tries to Recover.

Hello,
The 160th issue of On-chain Insights by IT Tech is out! I appreciate your support, over 5,000 subscribers strong! Not subscribed yet? Now's the time to join! 👇
Happy New Year to everyone.
Wishing you green portfolios and an awesome time for you and your family.
🎥 YouTube Channels + Website Launch.
After years of publishing on-chain research and growing the Polish IT Tech channel, I’m taking the next step.
1️⃣ New English YouTube Channel - Onchain_Insights by IT Tech
2️⃣ I reactivated my Polish YouTube channel.
3️⃣ New Website – btc-analysis.com
This is now the main hub for everything I publish:
Weekly Crypto Market Reports
On-chain dashboards - free for all
YouTube videos
Telegram & X links
Premium access and resources
The goal is simple - one link, all my content, updated in real time.
Table of contents:
🆓 Free content (for all free subscribers):
Top 10 Crypto & Macroeconomic News
Current market situation
New Telegram community for Active Traders
🔐 Premium Insights (exclusive for paid subscribers):
📺 Video version summary included 📺
BTC & ETH Market Overview: Spot & Futures Market Signals
Selective Leadership in a Fragmented Market
Realized Price & Short-Term Holder Stress: Key Cost Basis Levels in Play
Behind the Price: What Whales and Dolphins Reveal
U.S. Spot Demand: Coinbase Premium
Bitcoin and Ethereum Spot ETF Flows - Weekly Overview
Stablecoins Market Overview
Newsletter issue summary
Forecast for the Upcoming Week
1. Macro & Market News Recap (Dec 29, 2025 – Jan 4, 2026):
The holiday-shortened week closed out a volatile 2025 and opened 2026 with mixed but stabilizing signals across macro, equities, and crypto.
In crypto, 2025 ended net-negative after an early-year policy-driven surge and a sharp late-year crash. Bitcoin finished the year well below cycle highs and entered 2026 stabilizing around $89K–$90K, with volatility compressed and price coiling. The dominant narrative going into 2026 has shifted away from euphoria toward capital preservation, institutional adoption, and selective use cases such as ETFs, tokenization, and DeFi infrastructure.
Early 2026 trading saw BTC briefly push above $90K, supported more by holiday liquidity than conviction flows. Volatility expansion risk is rising after weeks of compression, while crypto-linked equities staged a modest rebound following December’s selloff.
U.S. equities started 2026 on a firmer note. The Dow and S&P 500 snapped a four-day losing streak, led by semiconductors, while the Nasdaq lagged slightly. This comes after a strong 2025 overall: the S&P 500 closed the year up over 16%, marking a third consecutive year of double-digit gains despite a weak December and no Santa Claus rally.
Looking ahead, the Wall Street consensus is unusually aligned. Major strategists broadly expect U.S. equities to rise again in 2026, with S&P 500 targets clustering near 7,900–8,000, driven by AI-led earnings growth and expectations of gradual Fed easing.
On the policy front, Federal Reserve minutes reinforced a cautious stance. Officials remain divided on further rate cuts, with inflation risks still present. Projections point to stronger GDP growth (~2.3%) but limited easing, potentially just one cut in 2026. January labor market data is now the key catalyst.
In FX and commodities, the U.S. dollar firmed to start 2026 after its sharpest annual decline in eight years, while gold and silver rebounded from late-December pullbacks, finishing 2025 as relative outperformers.
Longer-term crypto forecasts for 2026 remain polarized. Institutional adoption, additional spot ETFs, and stablecoin expansion are cited as structural positives, while deep drawdown risk persists in speculative, retail-heavy tokens if liquidity tightens.
💬 Comment:
Entering 2026, markets are stable but far from complacent. Equities reflect confidence in earnings and policy normalization, while crypto remains in a repair and re-assessment phase rather than a renewed expansion. With volatility compressed and expectations elevated, the next leg will likely be driven by data confirmation rather than narrative momentum. This environment favors patience, selectivity, and a focus on structure and flows over headline-driven positioning.
2. Current market situation.
Market Structure (1W Overview):
Weekly structure still reflects a fragile bounce inside a damaged, late-cycle regime. BTC is stabilizing above support but remains capped below major resistance, dominance stays elevated, and altcoins remain structurally weak.
Weekly structure remains heavy: BTC is holding above the 90K support band but trades well below the broken 95K–100K zone, dominance sits near 60%, and the broader altcoin market shows no clear leadership.
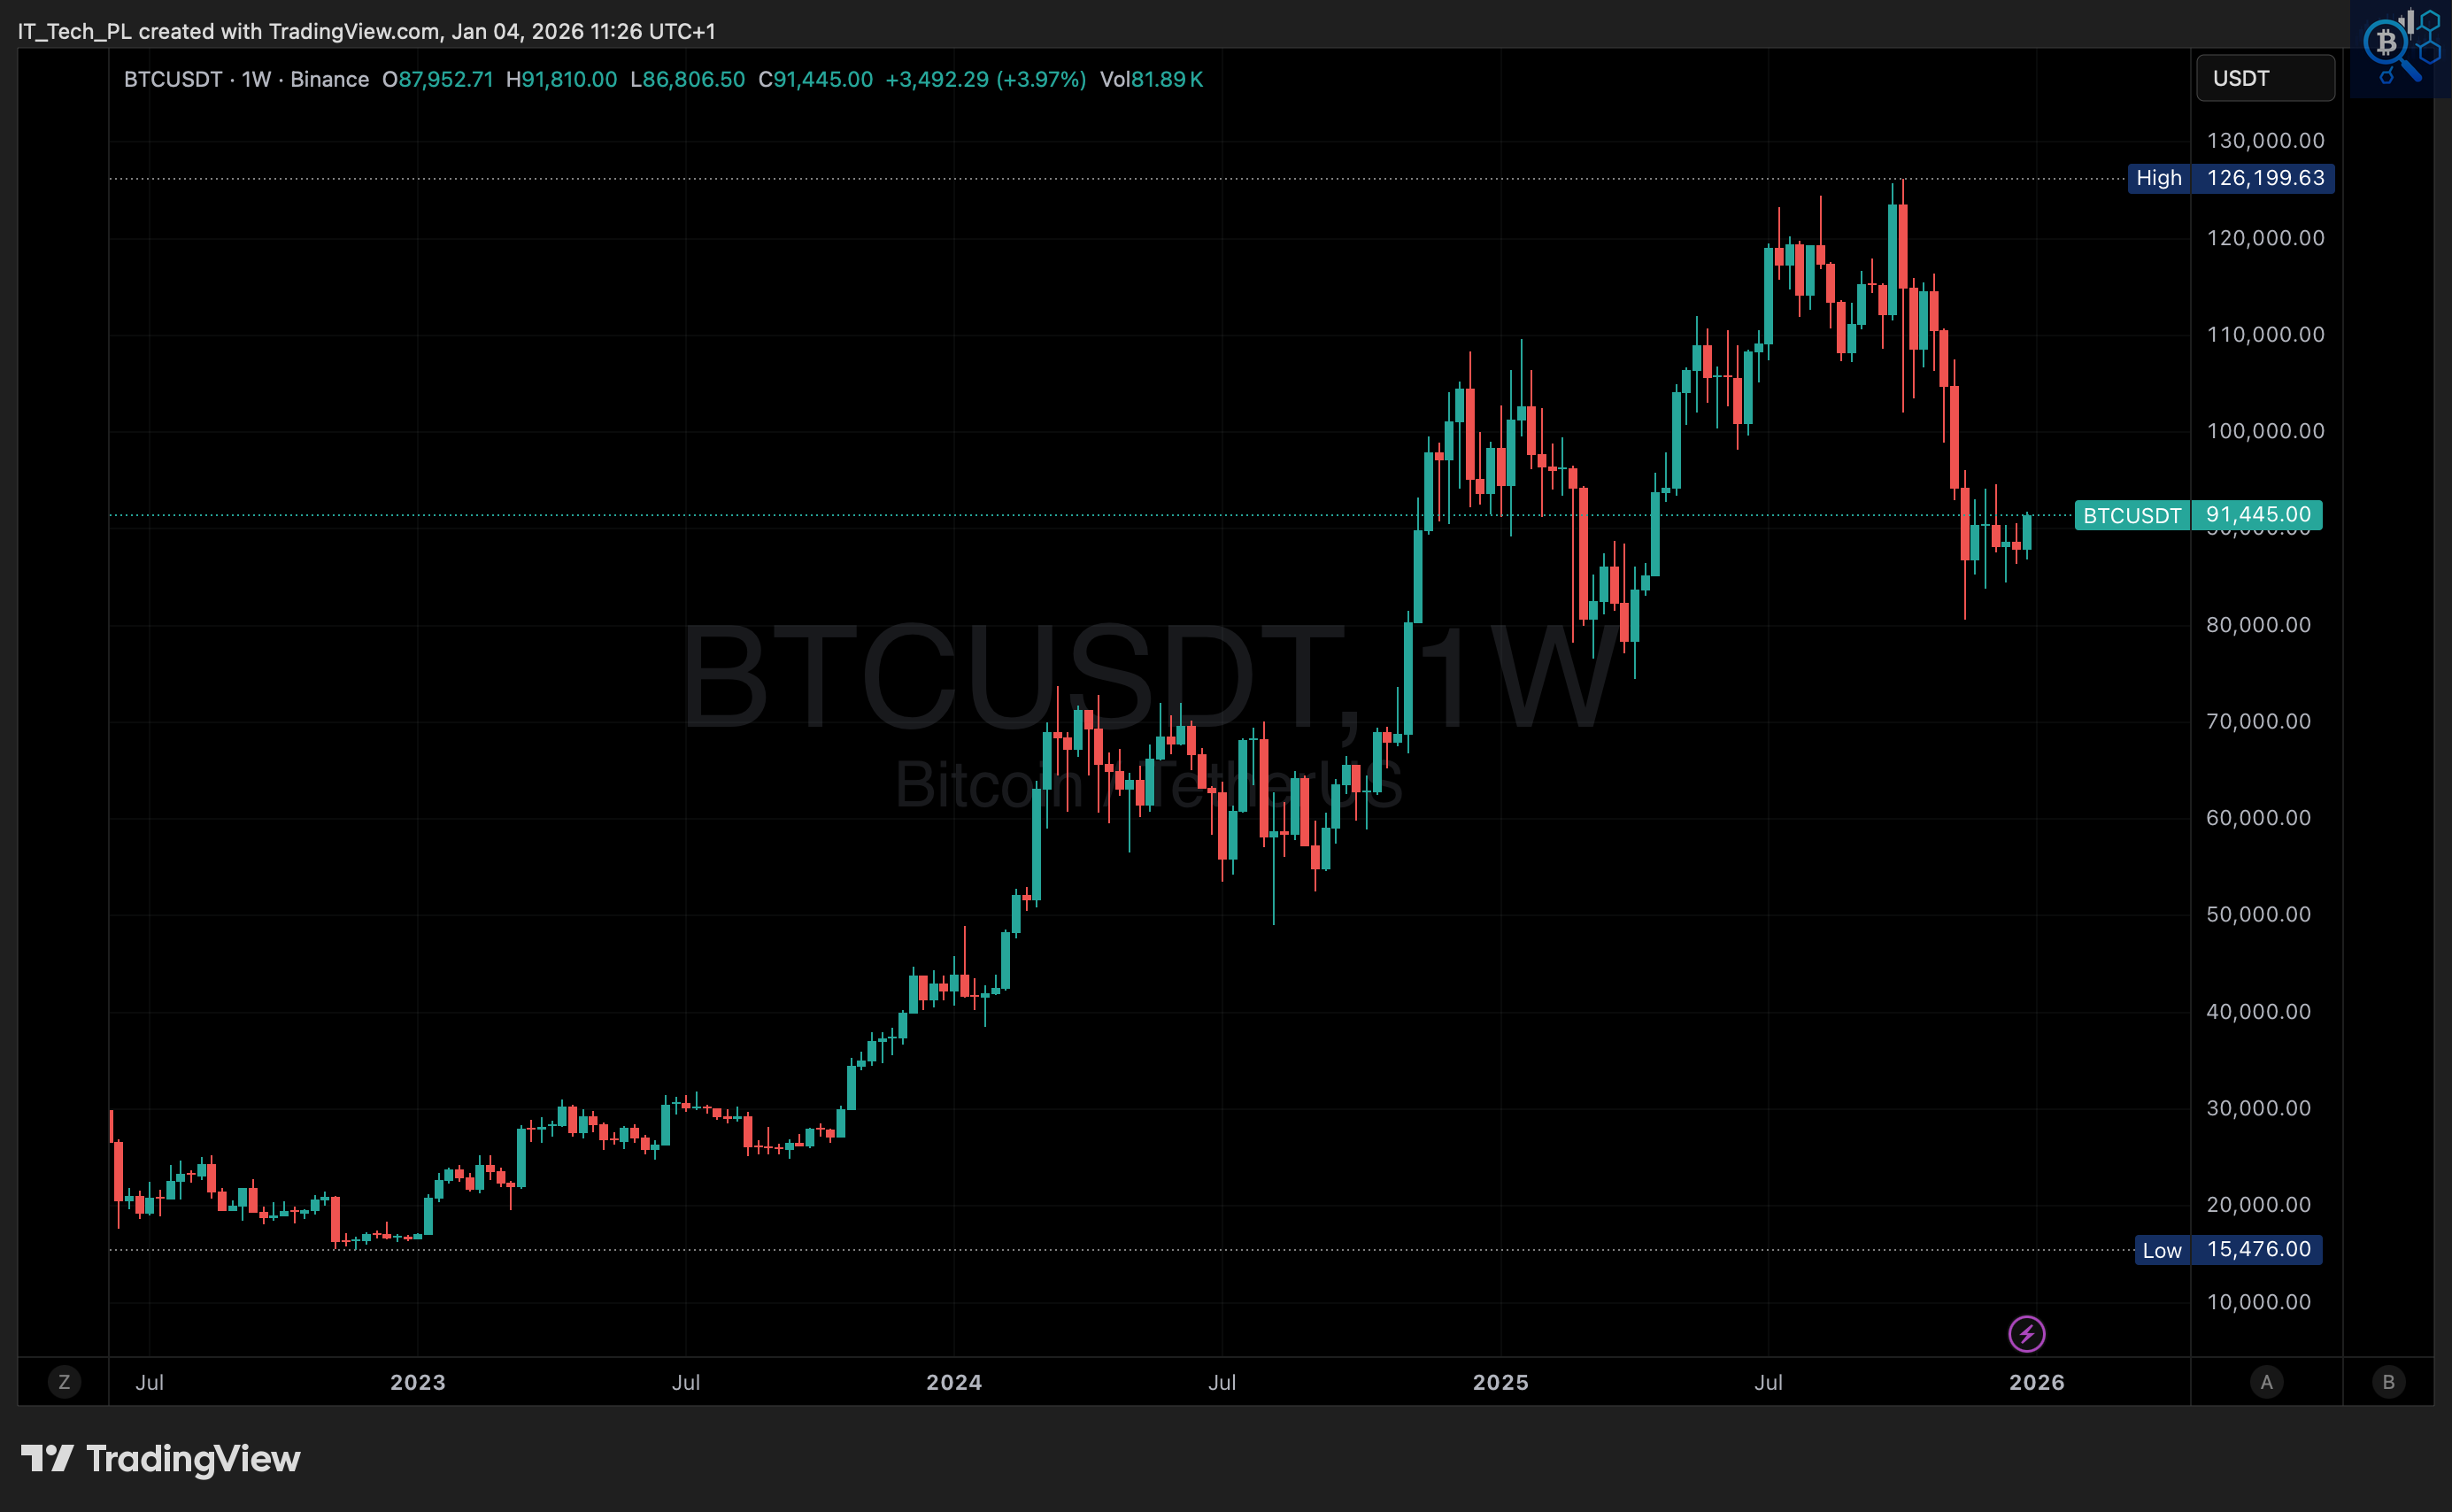
Bitcoin at ~$91.4K (up w/w), bounce still capped below 95K–100K
This week’s range was roughly 86.8K–91.8K. Price managed a modest rebound from the recent lows but failed to reclaim the low-90K area decisively and remains well below the broken 95K–100K support zone and the 120K–126K cycle peak. Recent weekly candles continue to form a consolidation after the sharp drop from the highs, not a reversal structure. The 80K–85K region remains the key downside support, while 95K–100K is the first meaningful resistance band. Below it, the move off the lows still looks like stabilization and repair rather than a renewed impulse.
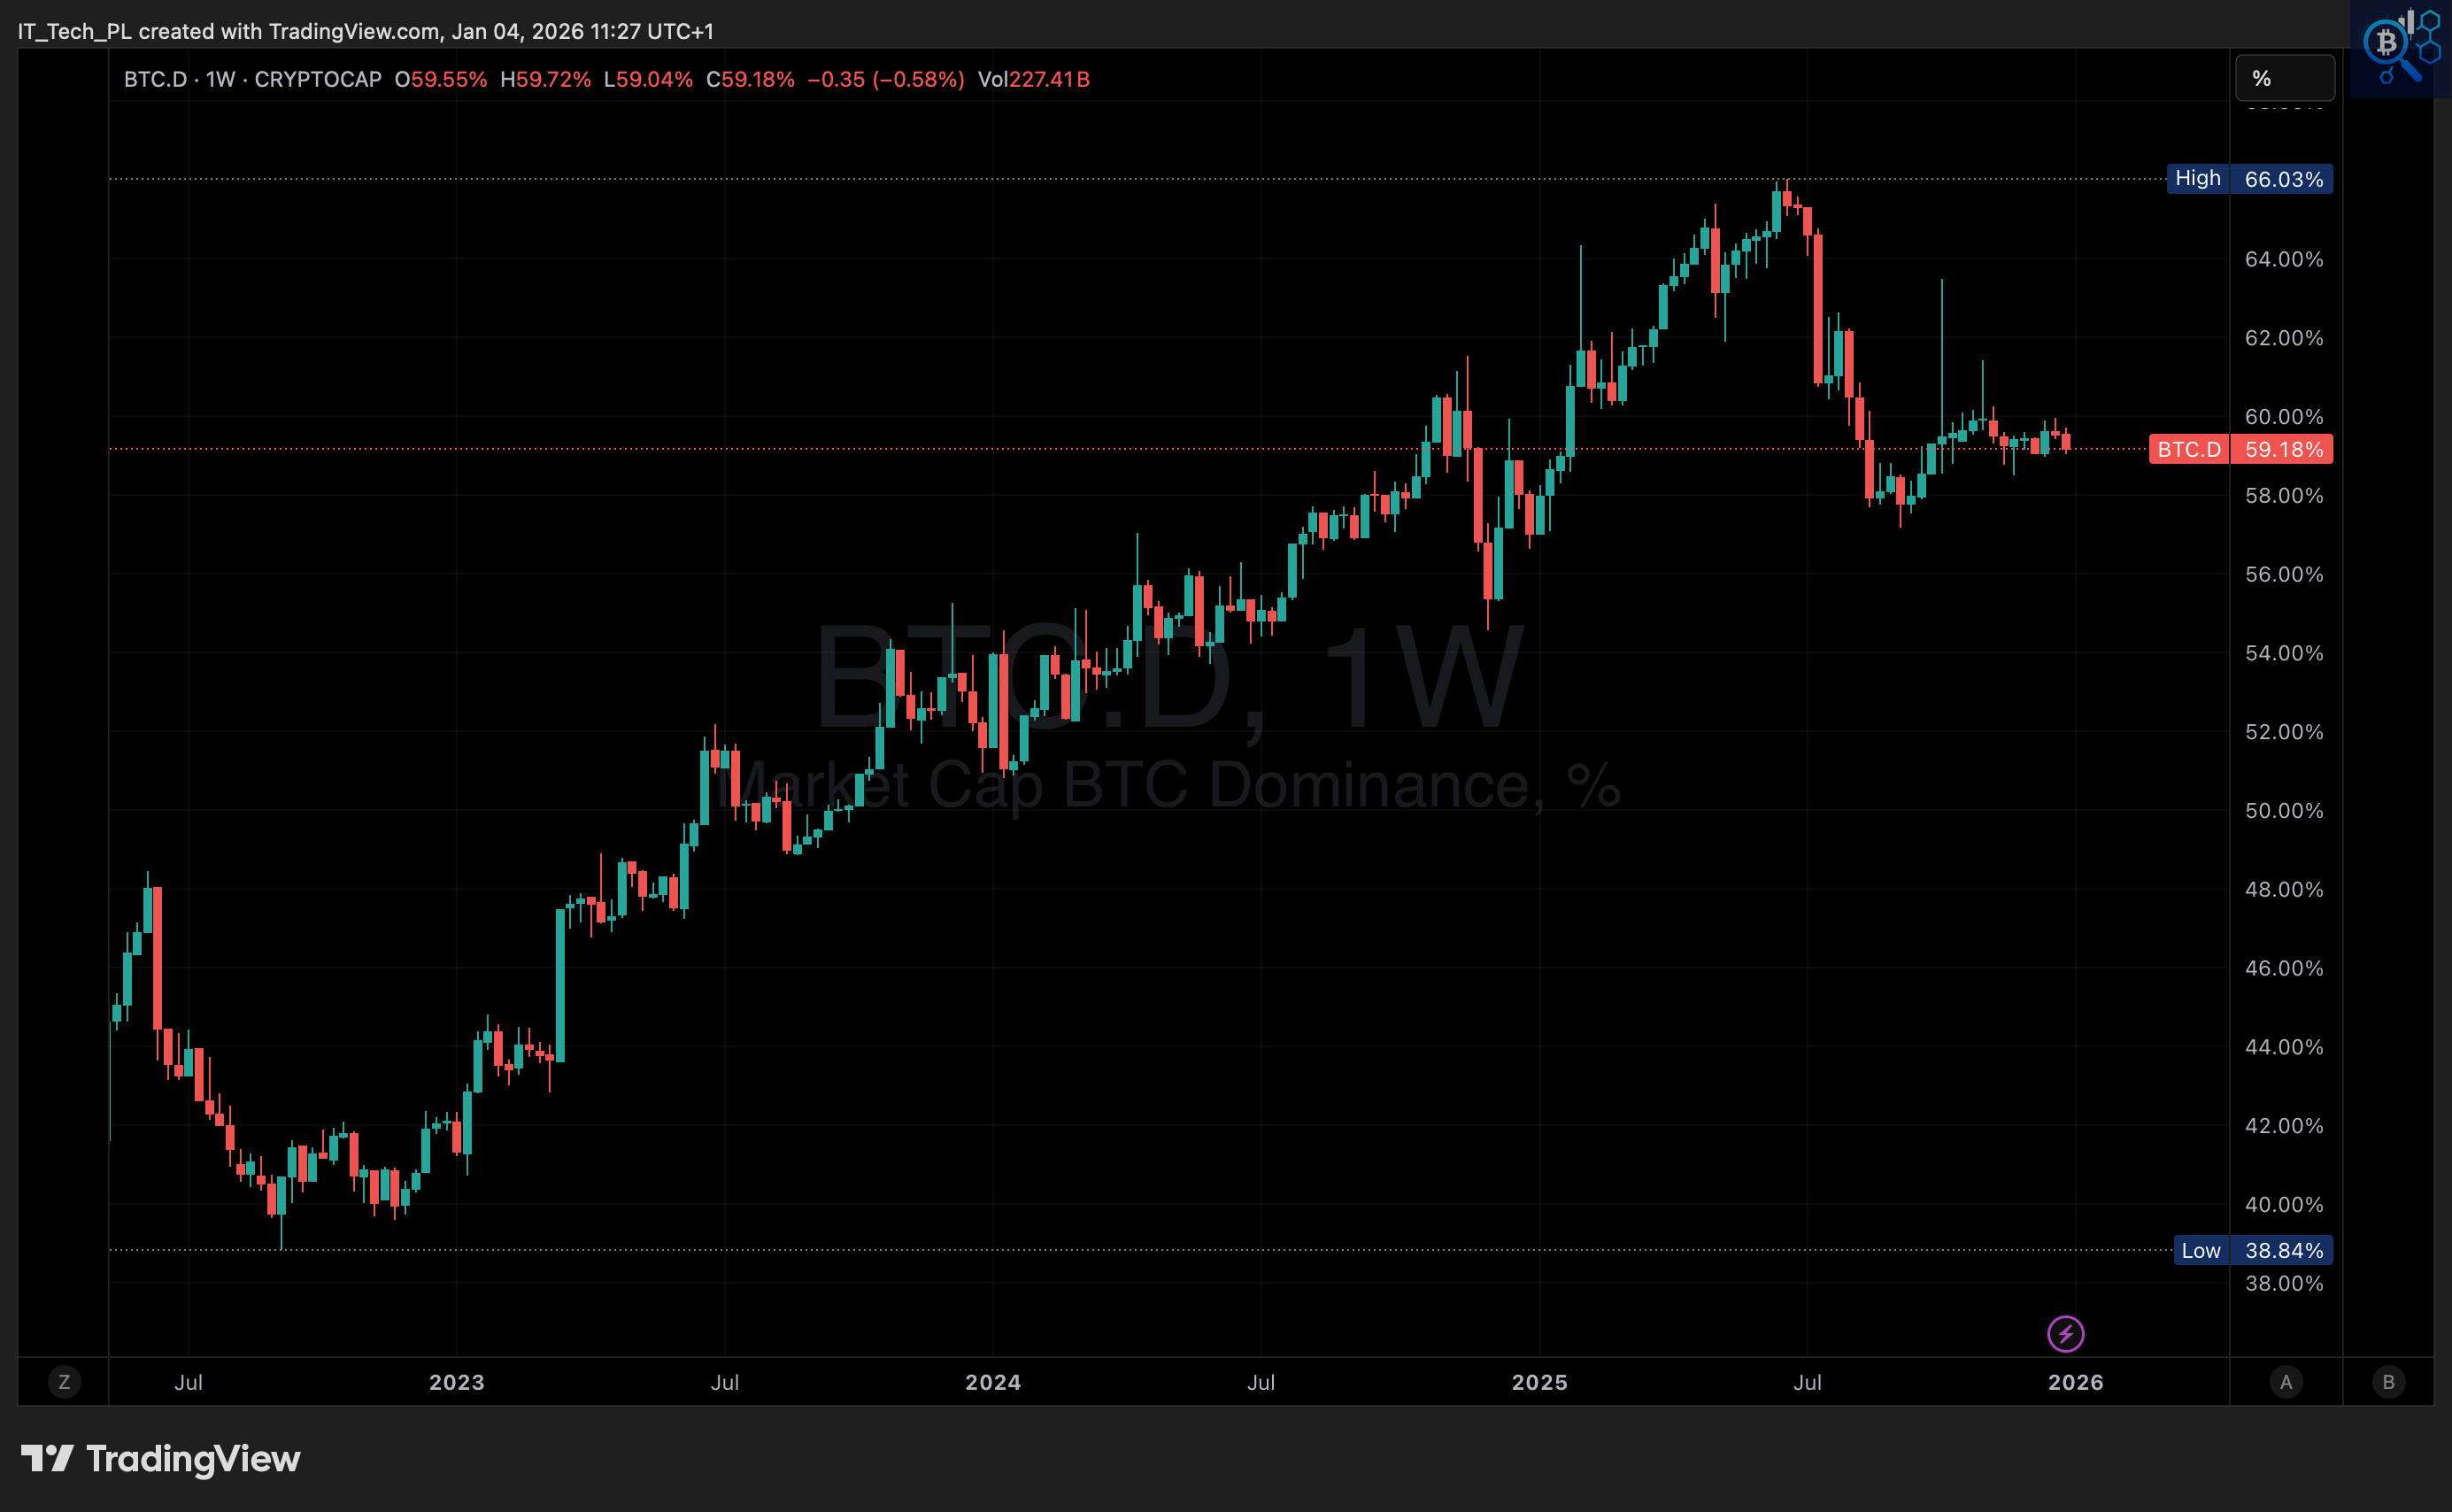
BTC.D at ~59.2% (slightly down w/w), dominance elevated and sticky
Dominance traded roughly between 58.8% and 60.5% and closed near the middle of the range. The broader trend since 2023 remains up, despite the pullback from the ~66% peak. Capital remains concentrated in BTC, and the lack of a decisive breakdown in dominance suggests that any altcoin strength continues to be rotational and short-lived rather than the start of a sustained altseason.
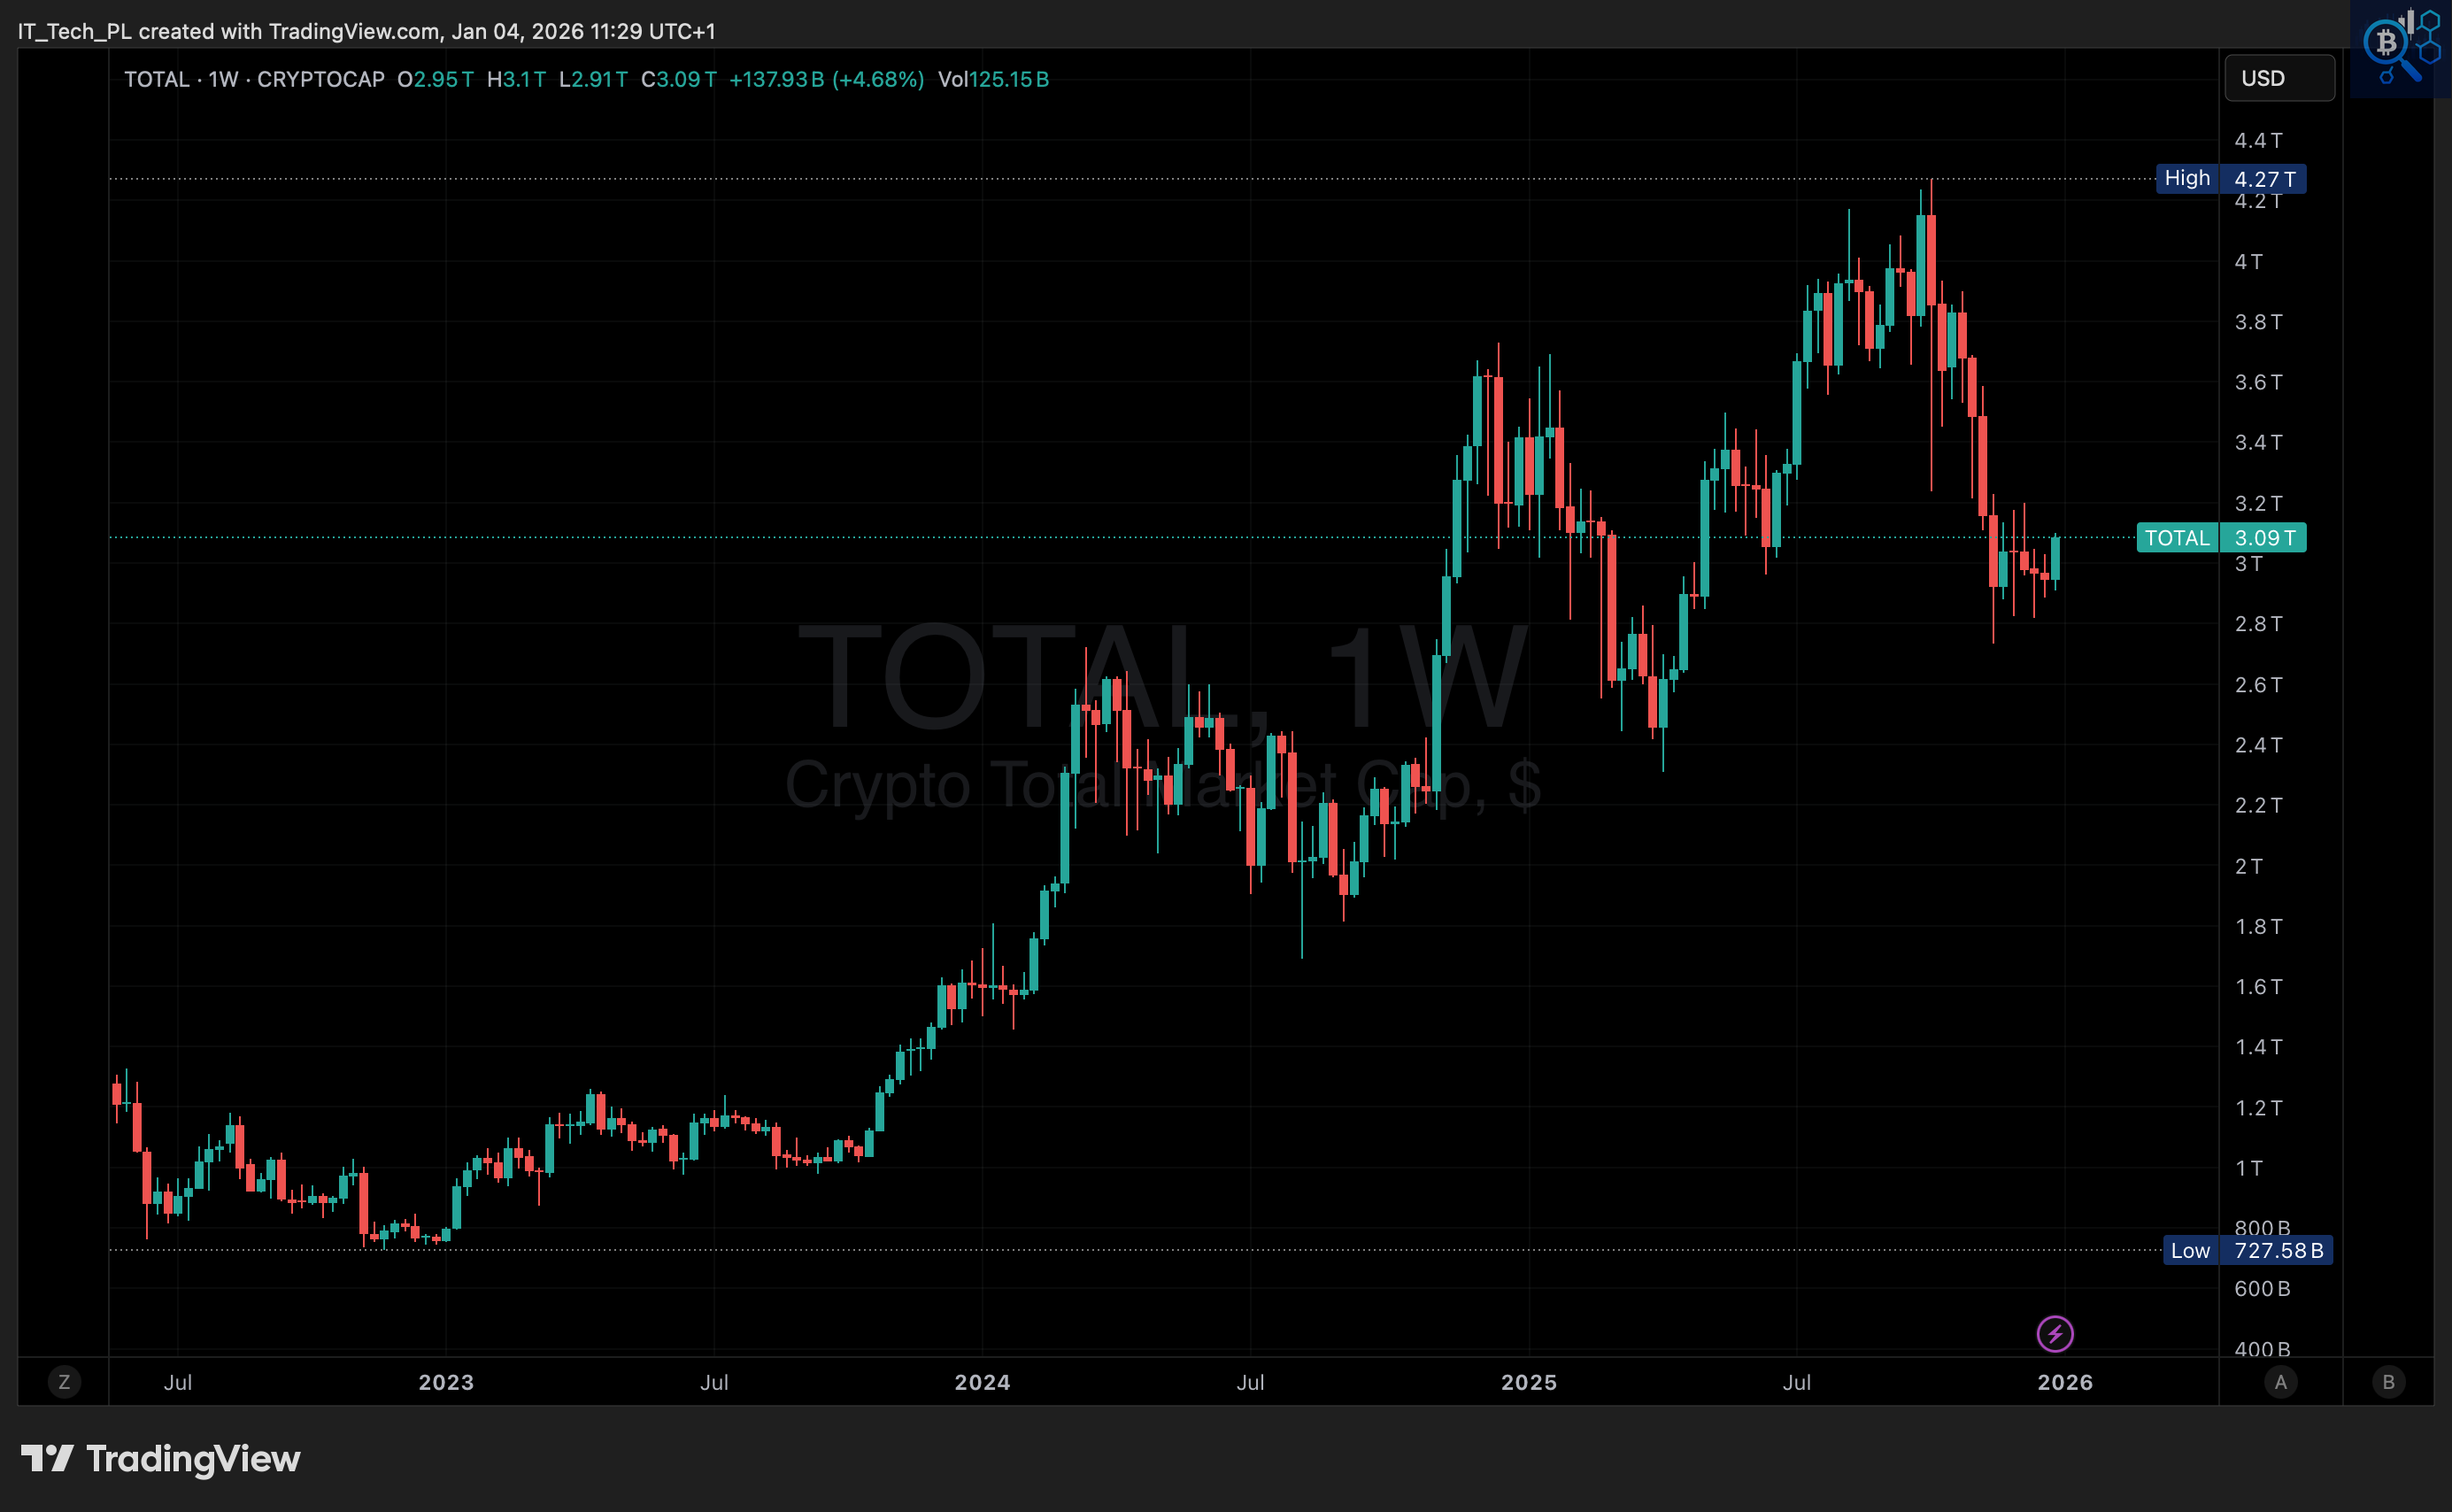
TOTAL at ~$3.09T (up w/w), holding above 3.0T but below key pivots
Total crypto market cap ranged roughly between 2.91T and 3.17T and finished just above 3.0T. While the bounce from the lows is constructive in the very short term, TOTAL remains clearly below the 3.2T–3.3T breakdown zone and far from the 4.0T–4.3T distribution peak. As long as 3.2T–3.3T is not reclaimed, the broader backdrop remains corrective, with the 3.0T area acting as a fragile floor rather than a launchpad.
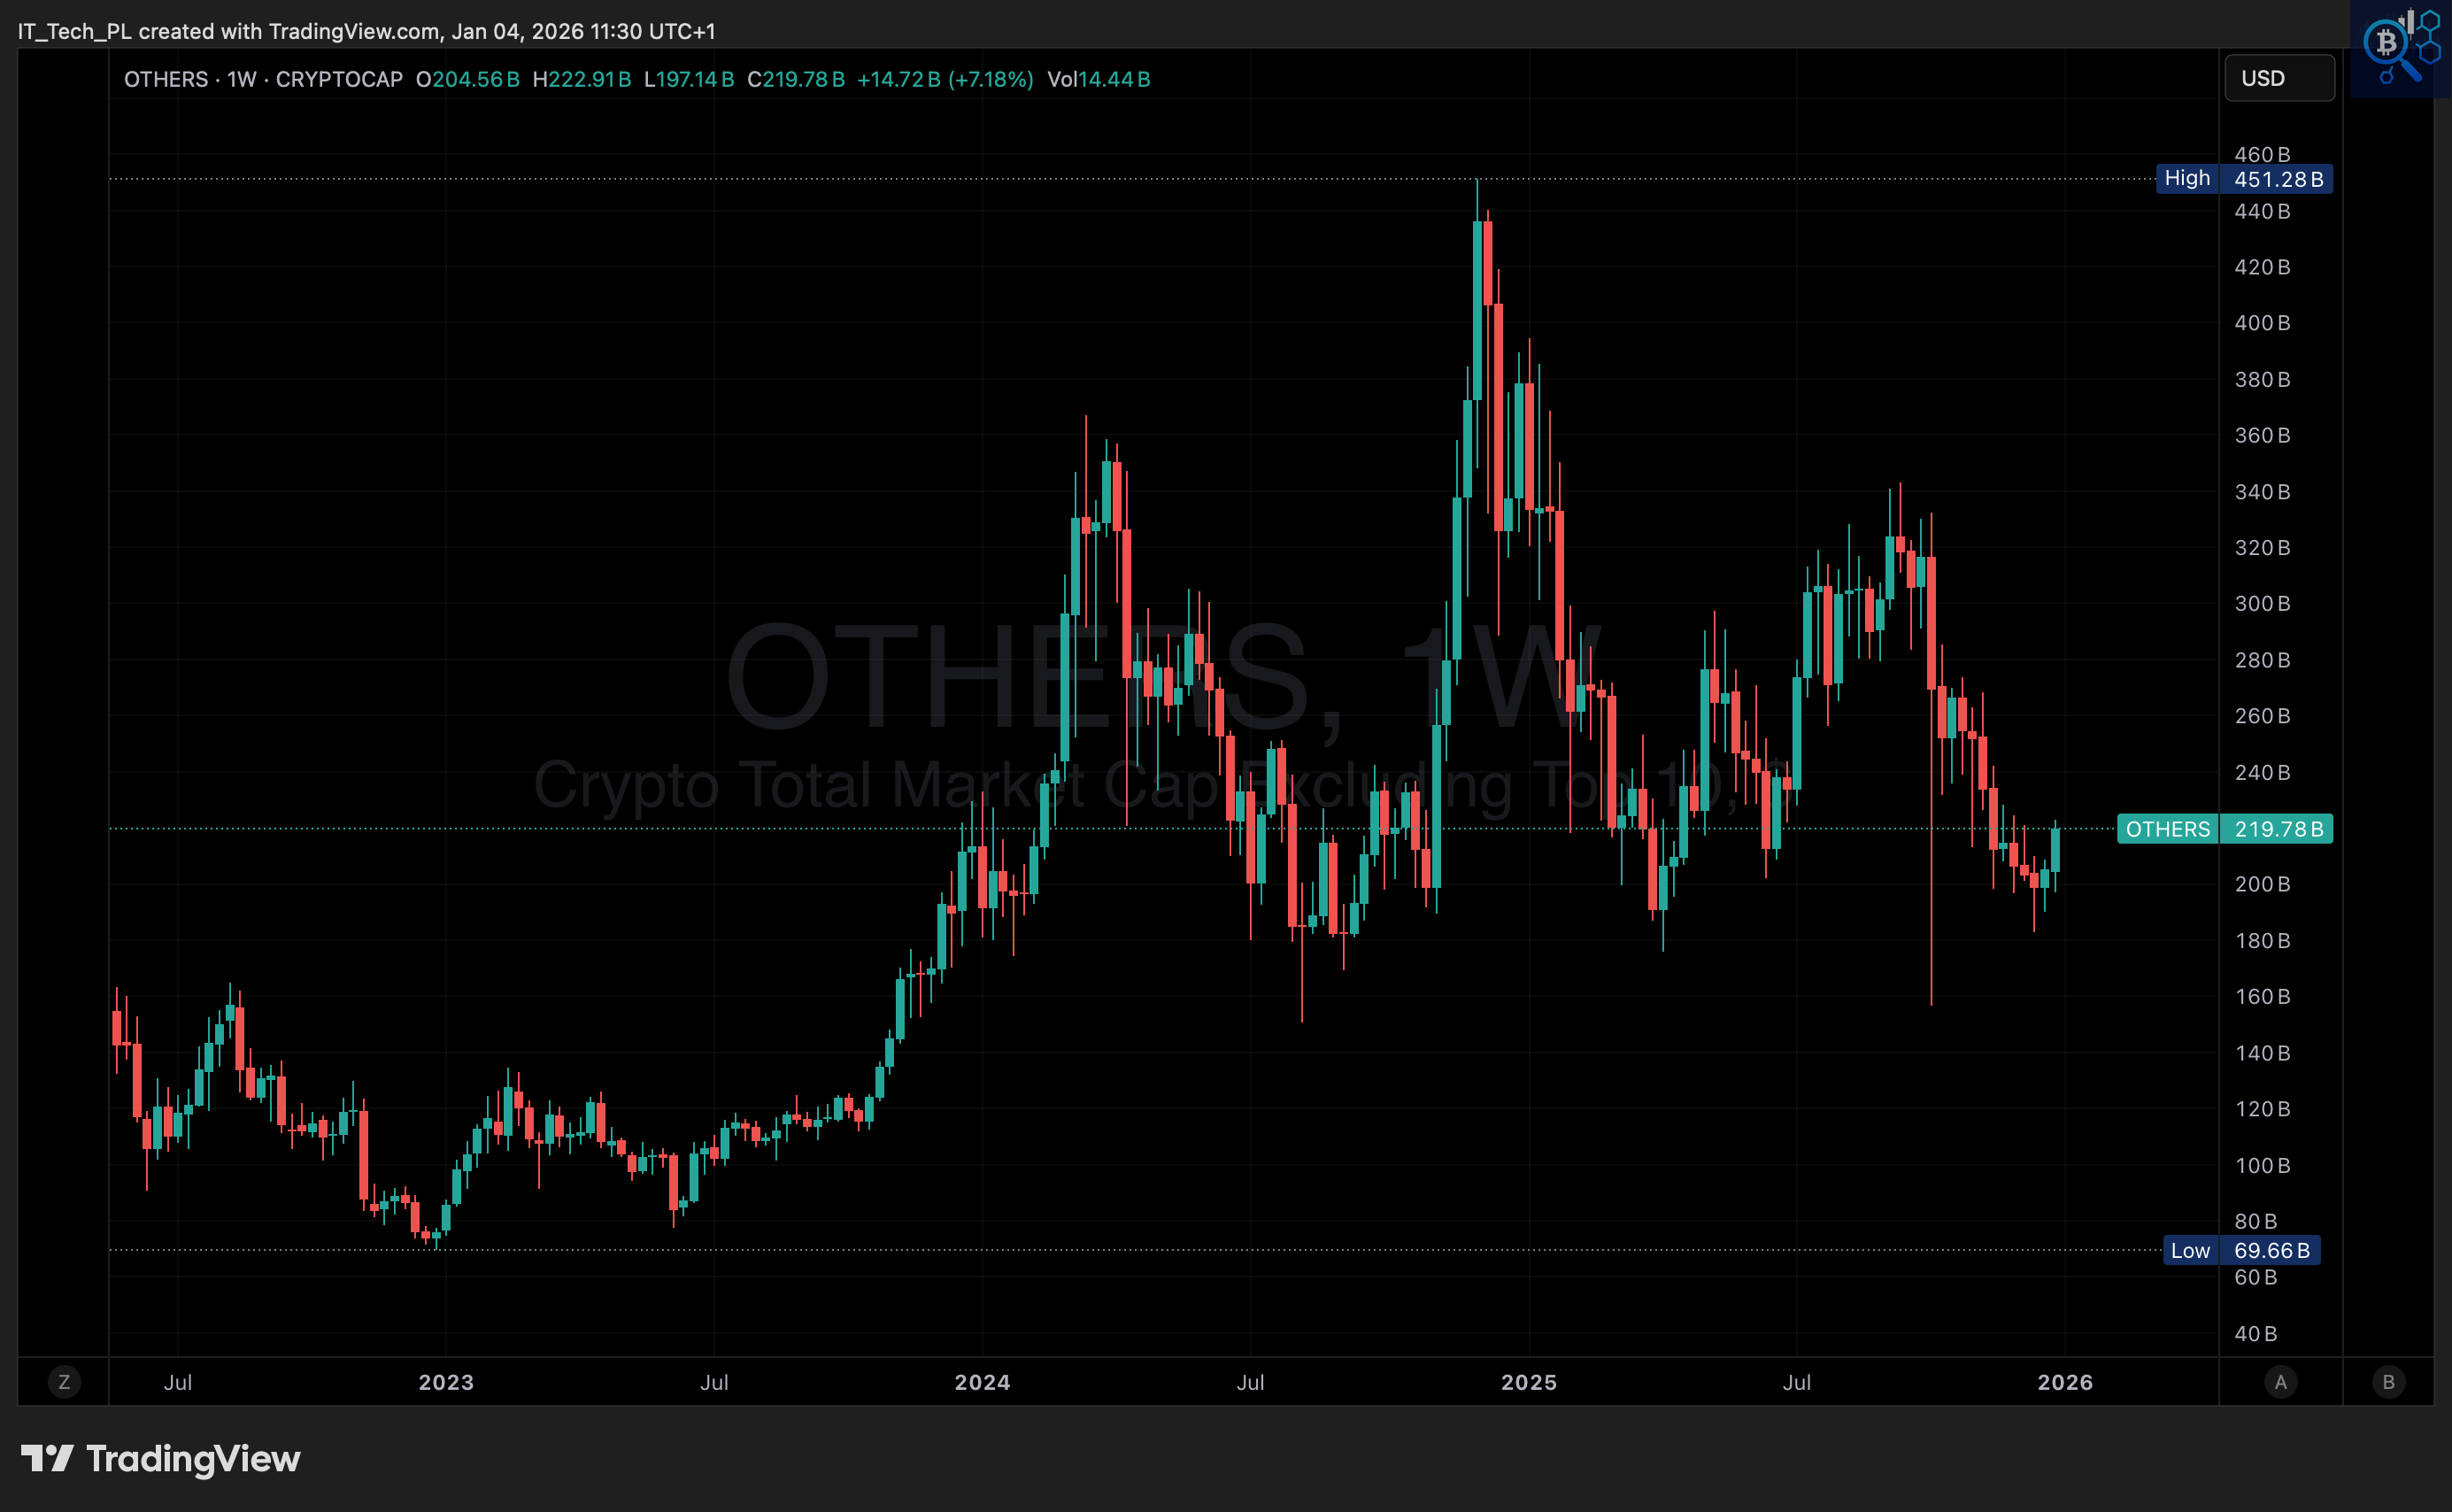
OTHERS at ~$220B (up w/w), altcoin basket still weak
The OTHERS index traded between roughly 197B and 223B and closed near 220B. Despite the bounce, it remains structurally weak, far below the 451B cycle high, and continues to print lower highs within a broad range. Altcoins remain the weakest segment of the market. Recent strength looks more like a technical rebound from support than the start of a trend change, with liquidity still thin and rallies vulnerable to selling.
Structure: BROKEN, SIDEWAYS CONSOLIDATION BELOW RESISTANCE
💬 Comment:
With BTC still below the 95K–100K resistance zone, TOTAL capped under 3.2T, and dominance holding near 60%, the weekly structure continues to favor a defensive stance. The rebound from the 80K area has evolved into sideways consolidation rather than a new bullish leg, while altcoins remain fragile and range-bound. Until BTC can reclaim and hold above 95K–100K on a weekly close and OTHERS begin forming sustained higher lows, the base case remains late-cycle distribution or early bear conditions, characterized by choppy price action and limited upside follow-through.
")
Crypto Heatmap TOP 300 (7D): Green on the Surface, Fragile Beneath
Despite a broadly green heatmap, price action still reflects fragile participation and tactical buying rather than a genuine risk-on regime.
Majors show mild relief, not strength:
BTC (+1.3%) and ETH (+1.0%) are modestly higher on the week, with BNB, SOL, and XRP showing mixed performance. Gains remain shallow and uneven, pointing to short-term stabilization rather than renewed momentum.
Breadth looks better, quality remains weak:
Although green tiles dominate numerically, most advances are small and scattered. There is no broad, high-conviction move across market caps. This suggests positioning and short-term trades, not sustained inflows.
Speculative pockets outperform:
Stronger moves are concentrated in high-beta and narrative-driven names such as memecoins and smaller caps. Large-cap infrastructure and core DeFi remain muted, indicating opportunistic risk-taking rather than structural accumulation.
No clear sector leadership:
No sector is emerging as a durable leader. Performance remains fragmented with limited follow-through, which is inconsistent with early bull-phase behavior.
💬 Comment:
This heatmap reflects a tactical rebound within a fragile market structure. While conditions look better than last week, the absence of strong leadership and shallow gains across majors suggests the market is still in a repair or late-cycle phase. Until green clusters become larger, more persistent, and led by core sectors, rallies should be treated cautiously and used for risk management rather than as confirmation of a new trend.
3. New Telegram Community for Active Traders.

New! IT Tech Trading Setups group is now live.
Every weekday: Bitcoin and Ethereum trading setups based on liquidation levels, market structure, and momentum.
3-5 setups per week
Entry, Stop Loss, and Take Profit are all pre-calculated
No clickbait, just clean executions
Free tools that help you trade better
You can now join the group in two ways:
BingX (with KYC):
Register: bingx.com/partner/ITTECHPL
Complete KYC, deposit ≥ 100 USDT, and place 1 trade > $100
DM the bot: @IT_Tech_Trading_Setup_Bot → instant invite ✅
BloFin (no KYC, UK and US can also trade):
Register: partner.blofin.com/d/ITTech
Deposit ≥ 100 USDT and place 1 trade ≥ $100
Fill the 60-sec form: Google Form – access within 24h
🎁 Why join now?
⚡ Fresh setups drop weekdays only - structured, not FOMO
⚡ Liquidation maps + on-chain context included
⚡ Real methodology, 56.2% proven edge
Pick your exchange, lock in the bonus, and trade with me. See you inside! 🔥*Disclaimer: Educational content only. Not investment advice. Past performance does not guarantee future results.
🔐 Premium Insights (exclusive for paid subscribers).
🧠 Still using only the free version? You’re missing half the picture. Let’s deep dive into on-chain data and check what is driving the Bitcoin and crypto market.
Already subscribed? Scroll down to continue reading or watching the video version.
📺 Video version: Premium subscribers now get access to a full video version summary of each issue. Watch and stay ahead with deep on-chain insights.
4. 🔐 BTC & ETH Market Overview: Spot & Futures Market Signals.
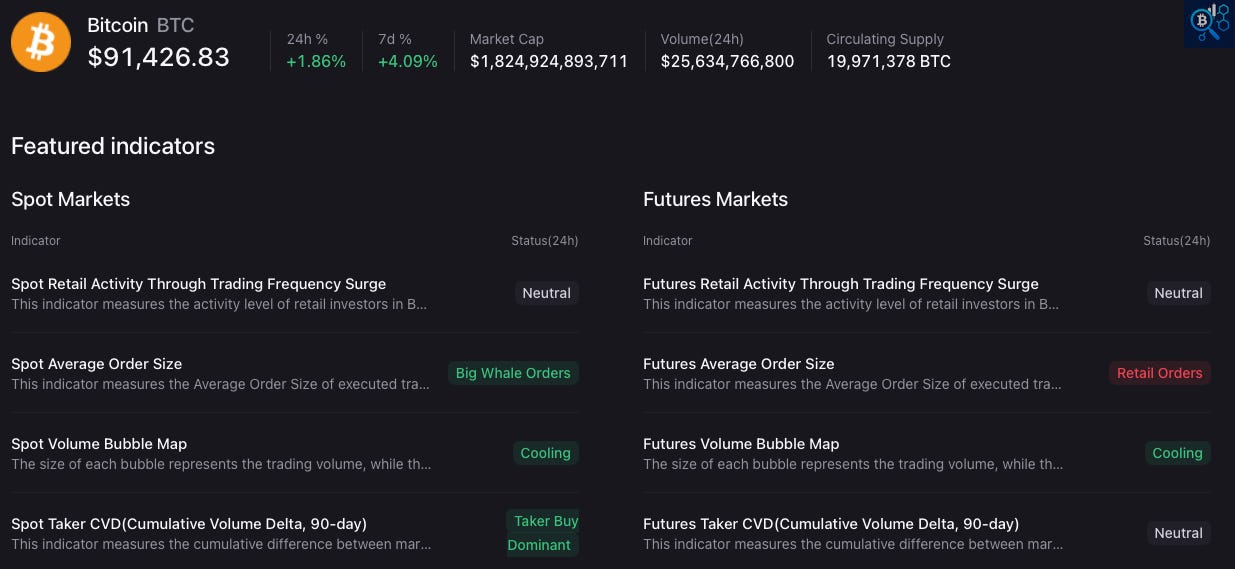
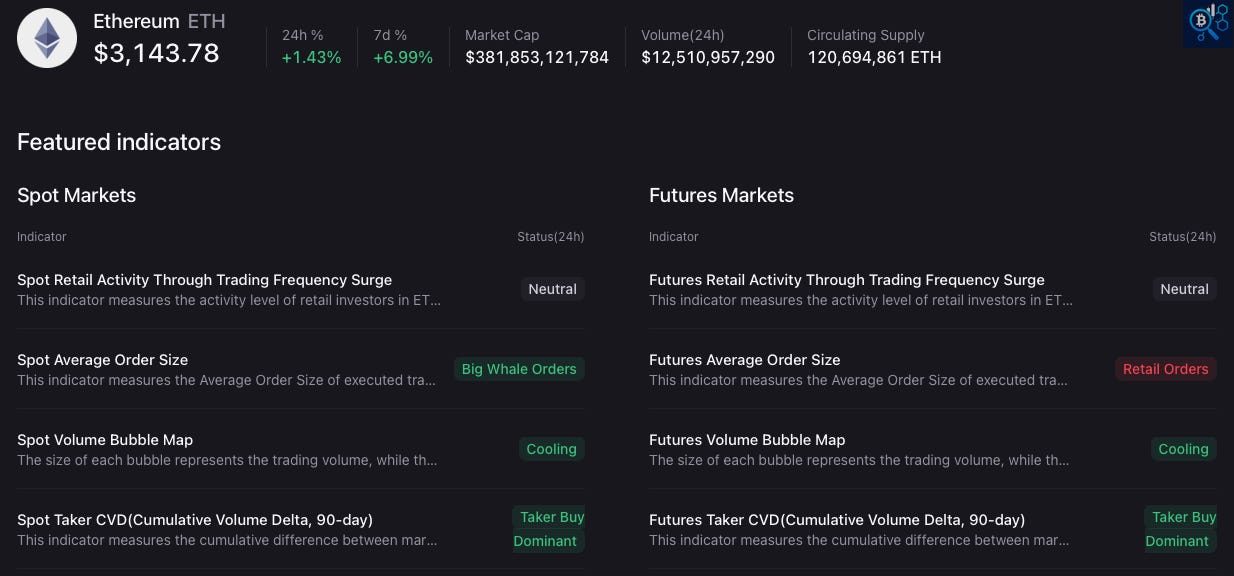
Spot flows are dominated by larger players, while futures remain retail-driven. This divergence suggests stabilization without conviction and reinforces a defensive, late-cycle regime.
Bitcoin (BTC): trades near $91.4K, with moderate weekly gains, but the internal structure of flows remains mixed.
On the spot side, average order size is flagged as Big Whale Orders, while retail trading frequency stays neutral. This points to selective accumulation or positioning by larger participants, not broad-based retail FOMO. Spot taker CVD (90-day) remains Taker Buy Dominant, confirming that buying pressure is still present, though it appears controlled and non-aggressive. At the same time, the spot volume bubble map shows cooling, indicating that activity is not expanding alongside price.
In futures, the picture is weaker. Average order size is flagged as Retail Orders, suggesting leveraged participation remains dominated by smaller traders. Futures taker CVD is neutral, and futures volume is also cooling. This combination implies limited leverage expansion and no strong directional conviction, reducing upside momentum but also limiting immediate liquidation risk.
Overall, BTC’s structure looks like spot-led stabilization with cautious positioning, rather than an impulsive breakout driven by leverage.
Ethereum (ETH): trades around $3.14K, outperforming BTC on a weekly basis, but flow dynamics show a similar split.
On spot, average order size again signals Big Whale Orders, while spot taker CVD is neutral. This suggests larger players are active, but without aggressive follow-through. Spot volume is cooling, reinforcing the idea that recent price strength is not backed by expanding participation.
On futures, ETH differs slightly from BTC. Futures taker CVD is Taker Buy Dominant, while average order size remains Retail Orders. This implies ETH’s recent outperformance is being driven more by retail leverage than by spot demand, making it structurally more fragile than BTC if momentum stalls.
Cross-Market Read:
Spot: whale-sized orders, controlled buying, cooling volume
Futures: retail-sized orders, limited conviction, selective leverage
Retail activity: neutral, not euphoric
Volume: contracting across both spot and futures
This configuration is typical of range-bound markets, where price can drift higher but lacks the fuel for sustained trend continuation.
Structure: STABILIZATION WITH DIVERGENCE BETWEEN SPOT AND FUTURES
💬 Comment:
The current spot–futures split reinforces a cautious outlook. Larger players appear active on spot, preventing breakdowns, while futures positioning remains retail-driven and restrained. This setup supports sideways consolidation rather than a strong directional move. For a healthier bullish regime, spot demand would need to expand alongside rising volume, and futures participation would need to shift away from retail dominance. Until then, price strength remains vulnerable to fading momentum rather than poised for acceleration.
5. 🔐 Selective Leadership in a Fragmented Market.
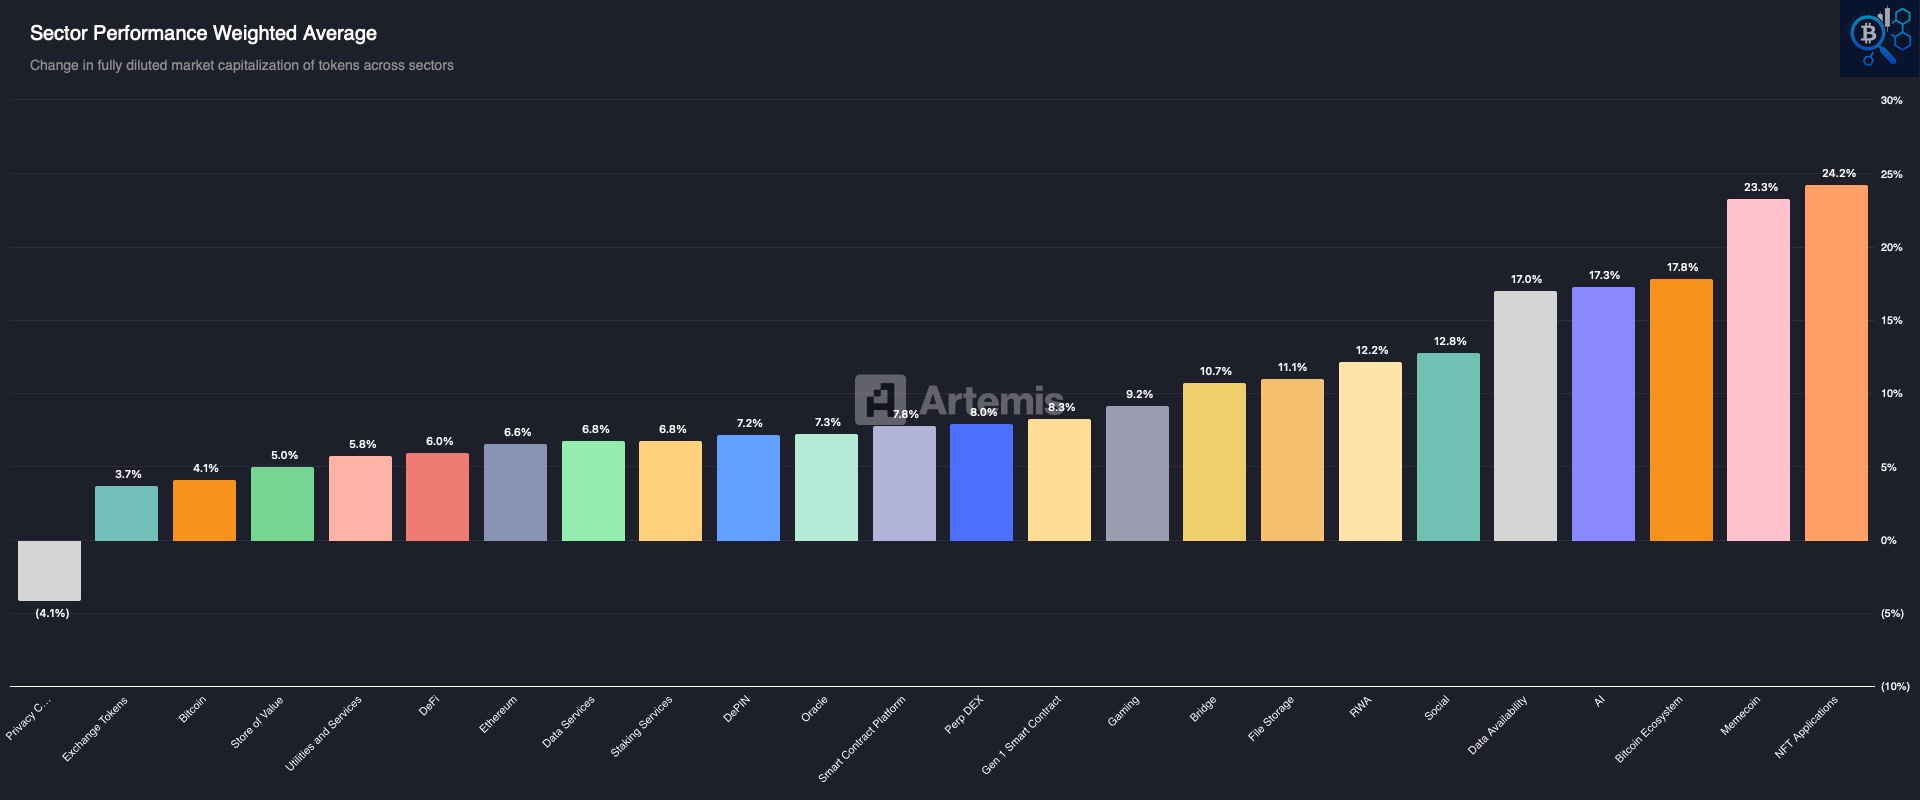
Sector Performance – Weighted Average, last 7 days
(Change in fully diluted market cap by sector, weighted by token size)
Sector performance shows selective, narrative-driven rotation rather than broad risk-on behavior. Leadership is narrow and defensive in character, consistent with a late-cycle or repair phase.
Sector Breadth and Leadership:
The dispersion across sectors remains wide. Only a handful of themes are posting double-digit gains, while a large portion of the market is delivering modest single-digit returns or lagging entirely. This pattern signals rotation, not expansion.
The strongest performers this week were:
NFT Applications (~24%)
Memecoins (~23%)
Bitcoin Ecosystem (~18%)
AI (~17%)
Data Availability (~17%)
These moves reflect short-term narrative trades and beta bursts, not a synchronized improvement in market structure. Notably, leadership is coming from high-volatility, sentiment-sensitive segments rather than foundational infrastructure.
Core Infrastructure Still Lagging:
Key structural sectors continue to underperform:
Ethereum (~6–7%)
DeFi (~6%)
Staking Services (~6–7%)
Data Services / Oracles (~7–8%)
Smart Contract Platforms (~8%)
These are typically the areas that lead during healthy, sustainable uptrends. Their relative weakness suggests capital remains cautious, favoring opportunistic trades over long-duration positioning.
Defensive and Late-Cycle Signals:
More defensive or utility-adjacent sectors such as File Storage (~11%), Bridges (~10%), and RWA (~12%) sit in the middle of the pack, reinforcing the idea that capital is prioritizing optional exposure and liquidity over growth conviction.
At the bottom end, Privacy Coins remain negative on the week, highlighting continued risk aversion toward niche or regulatory-sensitive areas.
Sector Structure Summary:
Leadership is narrow and unstable
Performance is driven by narratives, not fundamentals
Core infra and DeFi fail to confirm a regime shift
Rotation dominates over accumulation
Sector structure remains fragmented and late-cycle in character.
💬 Comment:
This type of sector performance is typical of markets in transition, not in acceleration. Strong gains in memes, NFTs, and AI contrast sharply with the muted response in infrastructure and DeFi, suggesting traders are extracting short-term opportunities rather than positioning for a sustained upside phase. Until leadership broadens and core sectors begin to outperform consistently, sector strength should be treated as tactical and fragile rather than as confirmation of a renewed bull trend.
6. 🔐 Realized Price & Short-Term Holder Stress: Key Cost Basis Levels in Play
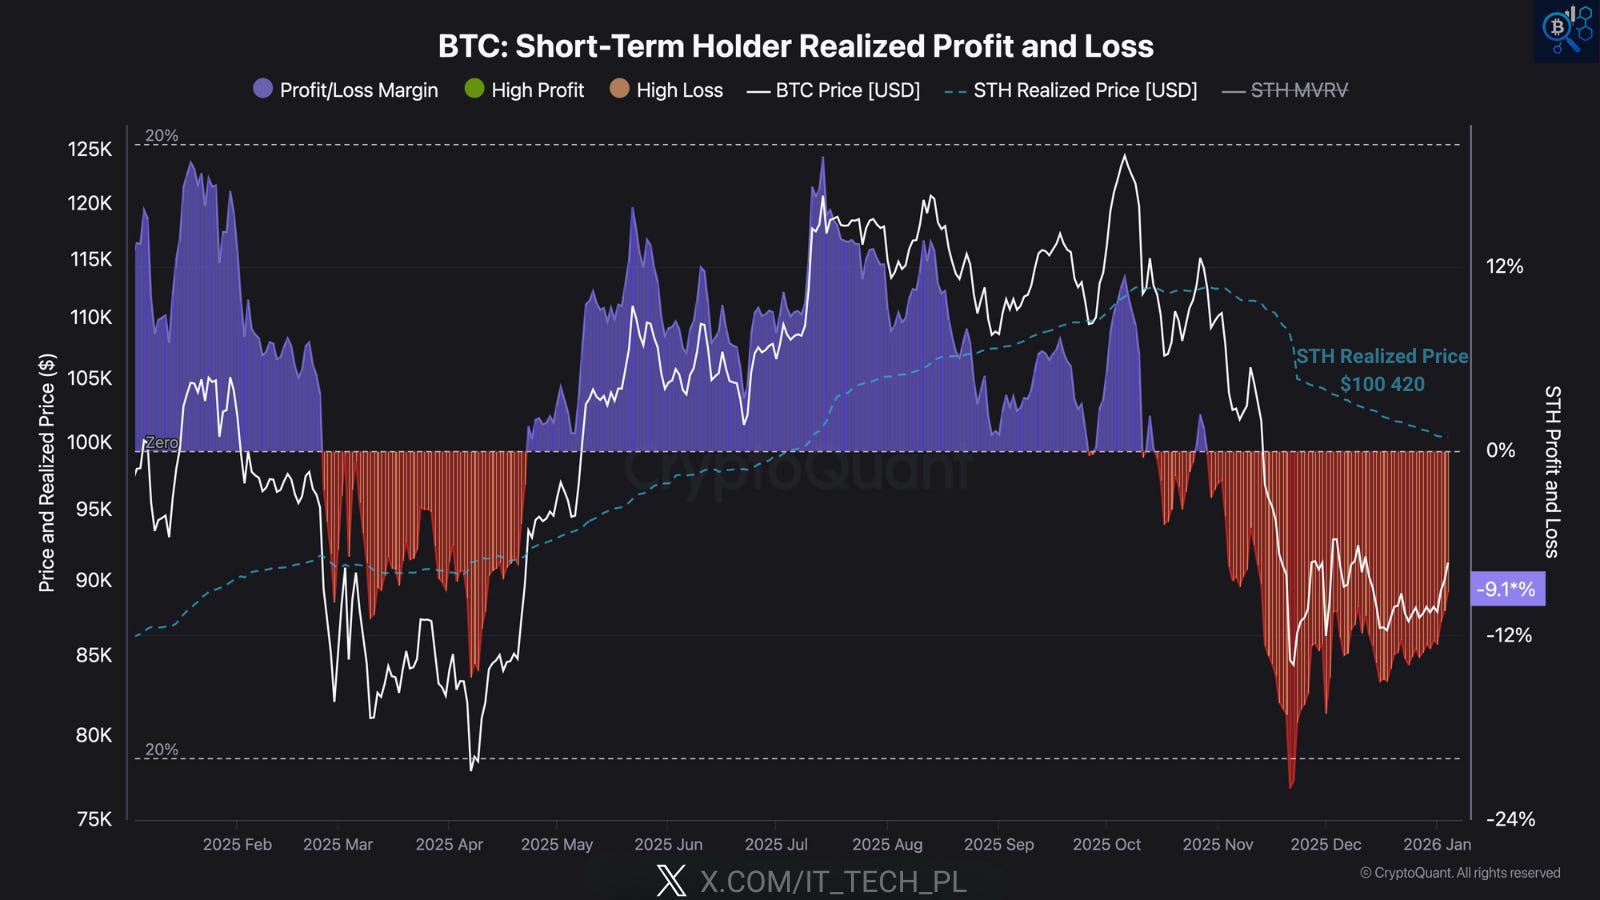
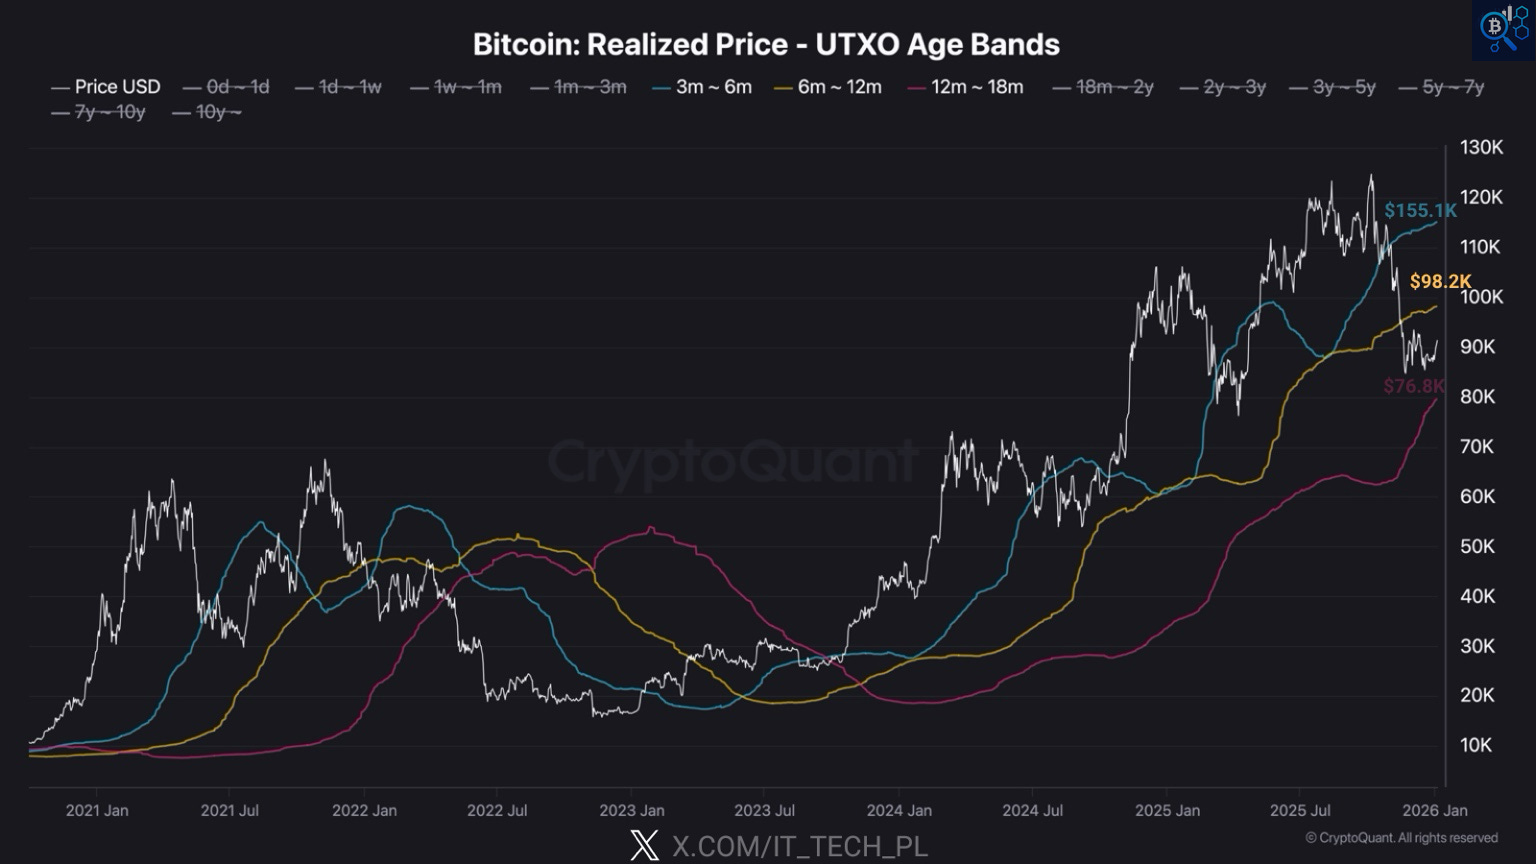
Bitcoin trades below short-term holder cost basis while hovering near key realized price bands, keeping the market in a fragile, late-cycle balance between support and distribution.
What the metrics show:
The UTXO Realized Price (age bands) highlights where different holder cohorts last transacted, defining major cost-basis support and resistance.
The STH Realized Profit/Loss tracks whether short-term holders are realizing gains or losses, a proxy for market fragility and overhead supply.
Key levels from the charts:
STH realized price (cost basis): ~$100.4K
3–6m realized price: ~$98.2K
6–12m realized price: ~$98.2K
12–18m realized price: ~$76.8K
BTC spot price: trading below ~$100K, with STH P&L still negative (~−9%)
Combined interpretation:
BTC is stuck below the short-term holder cost basis, keeping recent buyers underwater and prone to selling on rallies. The clustering of realized prices around $98K–100K forms a dense overhead supply zone. Failure to reclaim this band keeps pressure on price, while a loss of the $98K area would shift focus toward the deeper $76–78K long-term realized support.
💬 Comment:
As long as BTC remains below the STH cost basis near $100K, upside attempts are likely to meet sell pressure from underwater short-term holders. Reclaiming and holding above $98K–100K would be needed to ease stress and stabilize the structure. Until then, realized price data argues for caution and continued range-bound, distribution-style price action rather than a clean trend resumption.
7. 🔐 Behind the Price: What Whales and Dolphins Reveal.
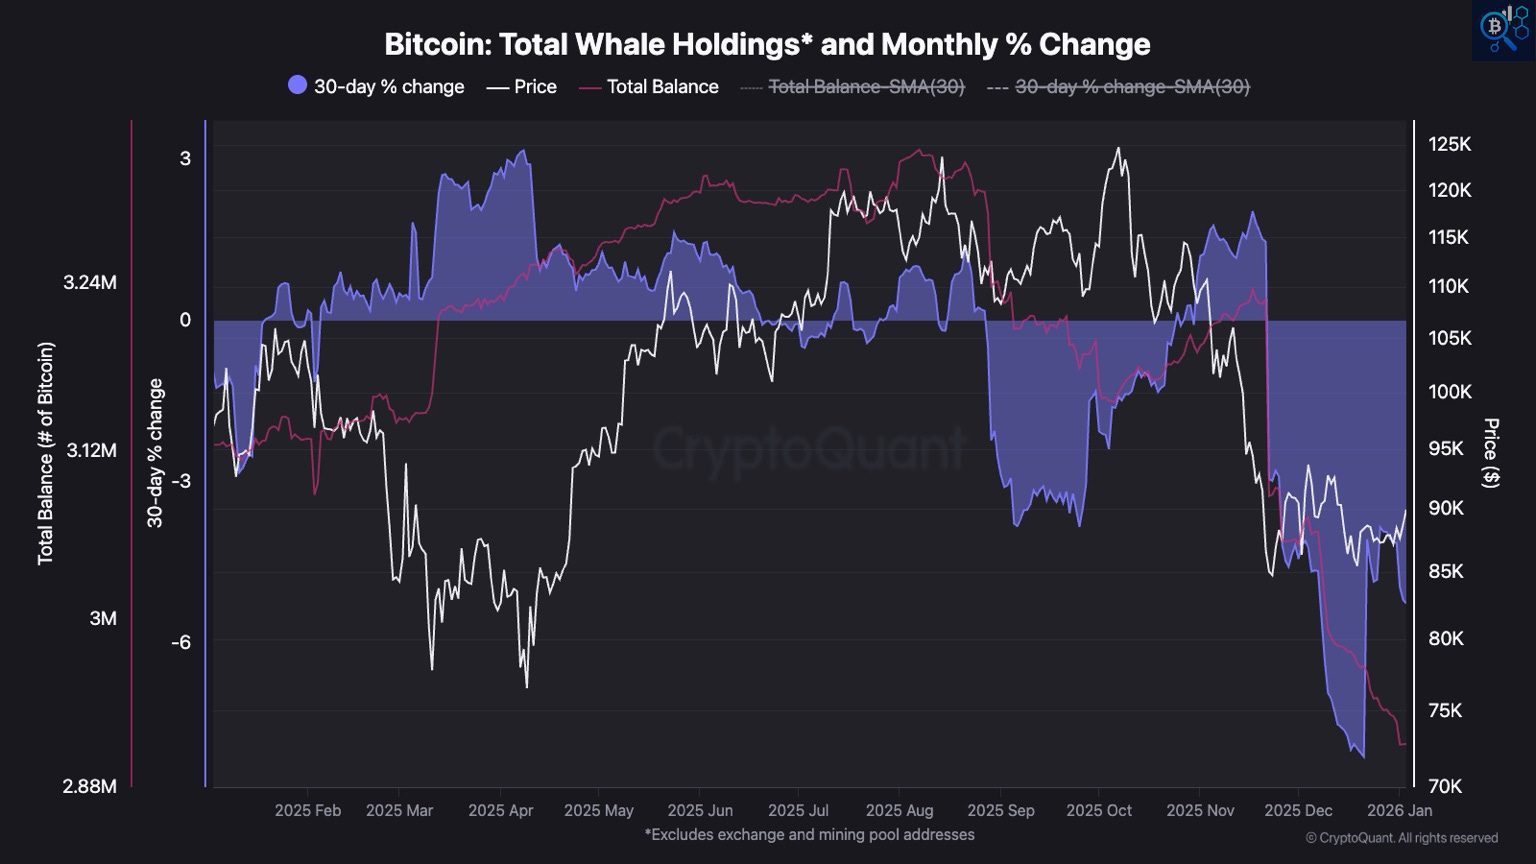
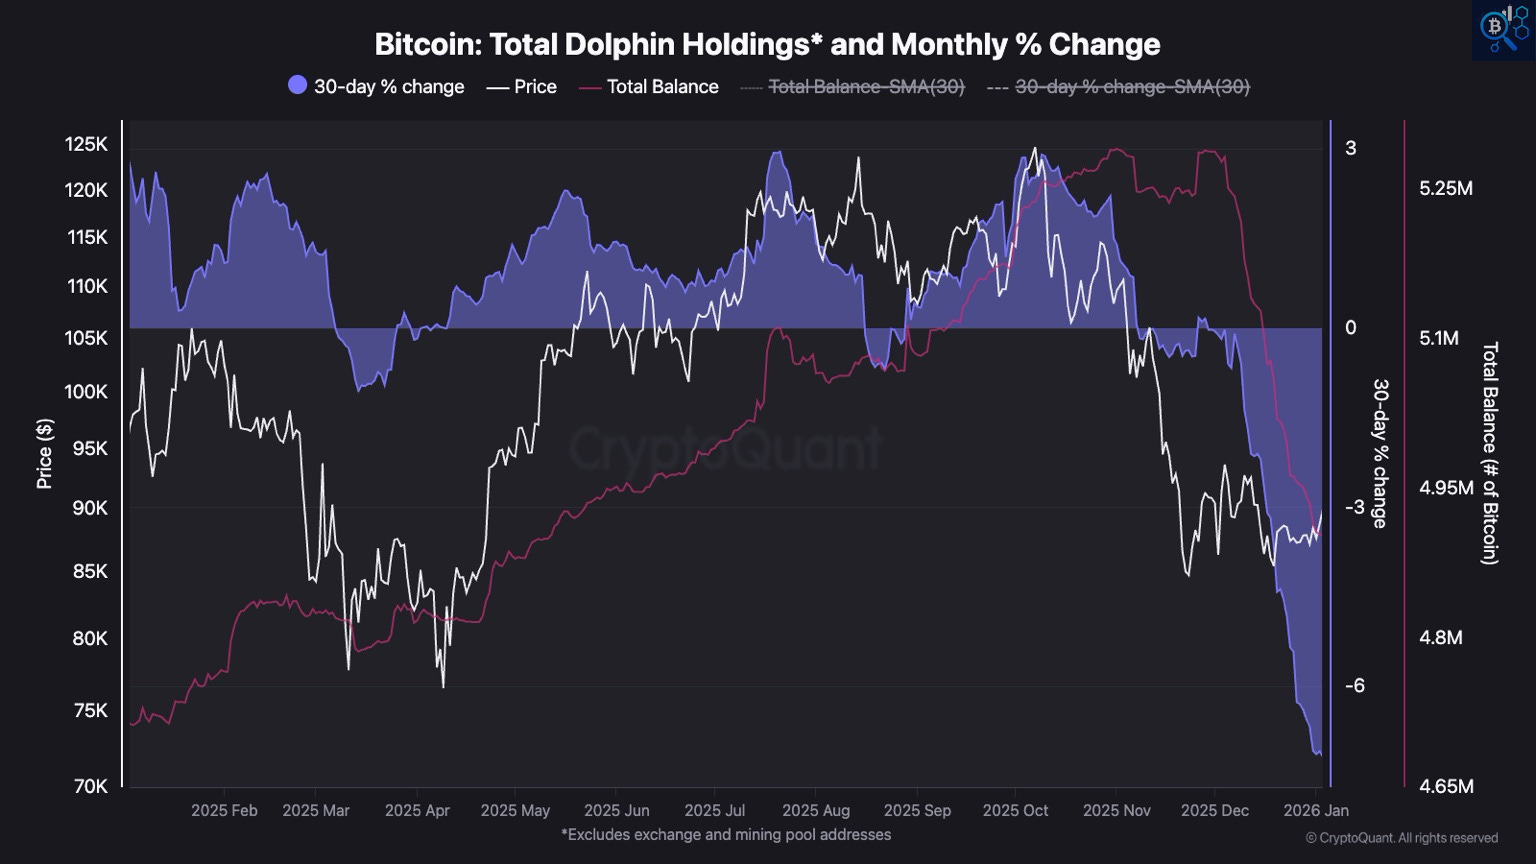
Changes in large holder balances point to shifting supply dynamics beneath the surface, adding context to the market’s fragile structure.
What the metrics show:
This section tracks total BTC balances and 30-day percentage change for two on-chain holder groups, as defined in the provided CSV files:
Dolphins: addresses holding 100–1,000 BTC, excluding exchanges and mining pools. This cohort often represents active funds, desks, and large private investors who tend to adjust exposure earlier in cycle transitions.
Whales: addresses holding ≥1,000 BTC, also excluding exchanges and miners. This group reflects long-term, strategic capital whose balance changes usually matter for the broader supply structure rather than short-term price noise.
Current state:
Both cohorts show negative 30-day balance changes, meaning net BTC distribution on a monthly basis. Dolphin balances are declining more aggressively, while whale balances are also trending lower, confirming that mid-sized and very large holders are reducing exposure simultaneously.
Context:
In previous cycles, dolphins often accumulate during corrections while whales stay neutral. The current setup, where both dolphins and whales distribute at the same time, has more often appeared during late-cycle transitions or early bear phases rather than during healthy bull-market consolidations.
Implications:
When large holders reduce balances together, rebounds tend to face supply from structurally informed participants. This weakens follow-through on rallies and increases the probability of range-bound or corrective price action rather than sustained upside.
💬 Comment:
The behavior of dolphins and whales reinforces the broader defensive picture seen across cost basis, short-term holder stress, and market structure. Until these cohorts stabilize or return to net accumulation, upside moves are more likely to be sold into than extended, keeping the market in a late-cycle, consolidation-driven regime rather than a renewed expansion phase.
8. 🔐 U.S. Spot Demand: Coinbase Premium.
📊 (Premium = Coinbase price above Binance. Positive = stronger U.S. spot bid.)
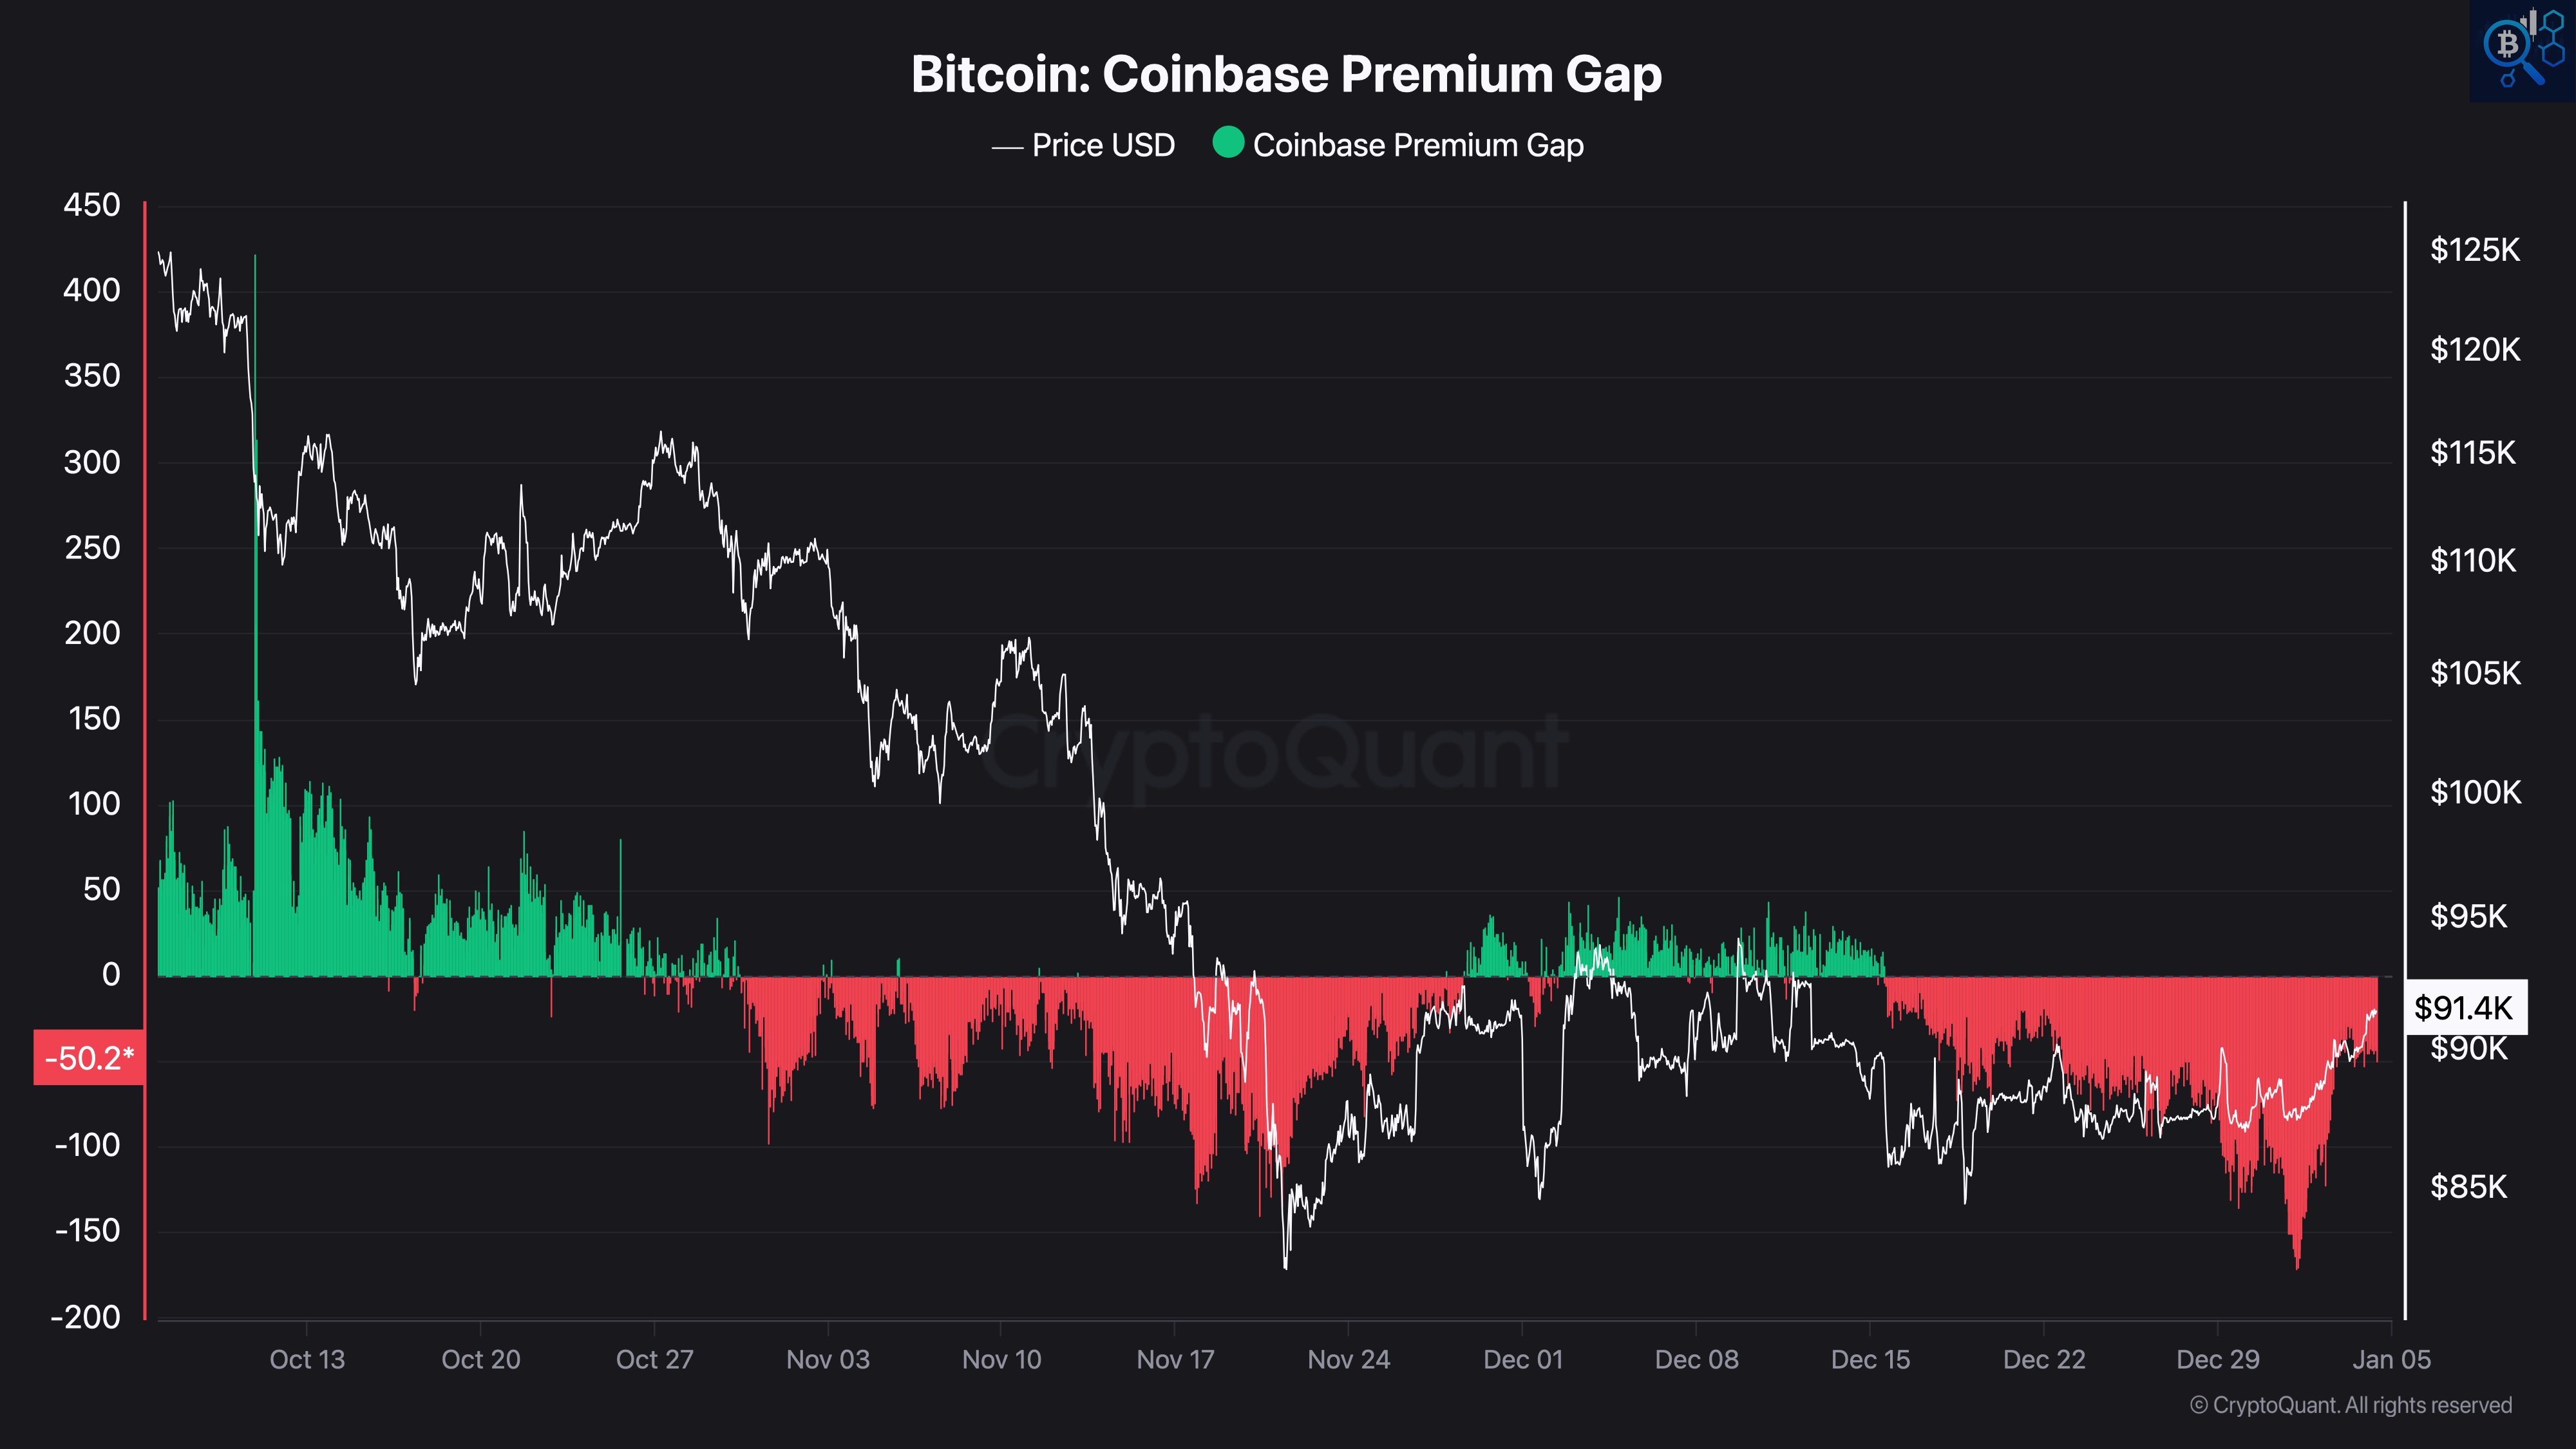
U.S. spot demand remains fragile. Brief stabilization attempts have faded, and both BTC and ETH premiums are still net-negative, reinforcing a defensive, late-cycle backdrop rather than renewed accumulation.
Bitcoin: Coinbase Premium Gap
BTC trades near $91.4K, but the Coinbase Premium Gap remains clearly negative despite the recent bounce. After a short-lived move back toward neutral in early December, the premium rolled over again and pushed deeper into negative territory before a modest rebound.
From a structural perspective, this shows that U.S. spot buyers are not driving price action. The recent stabilization in BTC has not been accompanied by sustained positive premiums, suggesting that the move higher is being supported more by global liquidity, derivatives positioning, or short-covering rather than fresh U.S. spot demand. As long as the premium fails to remain positive, upside moves remain prone to fading.
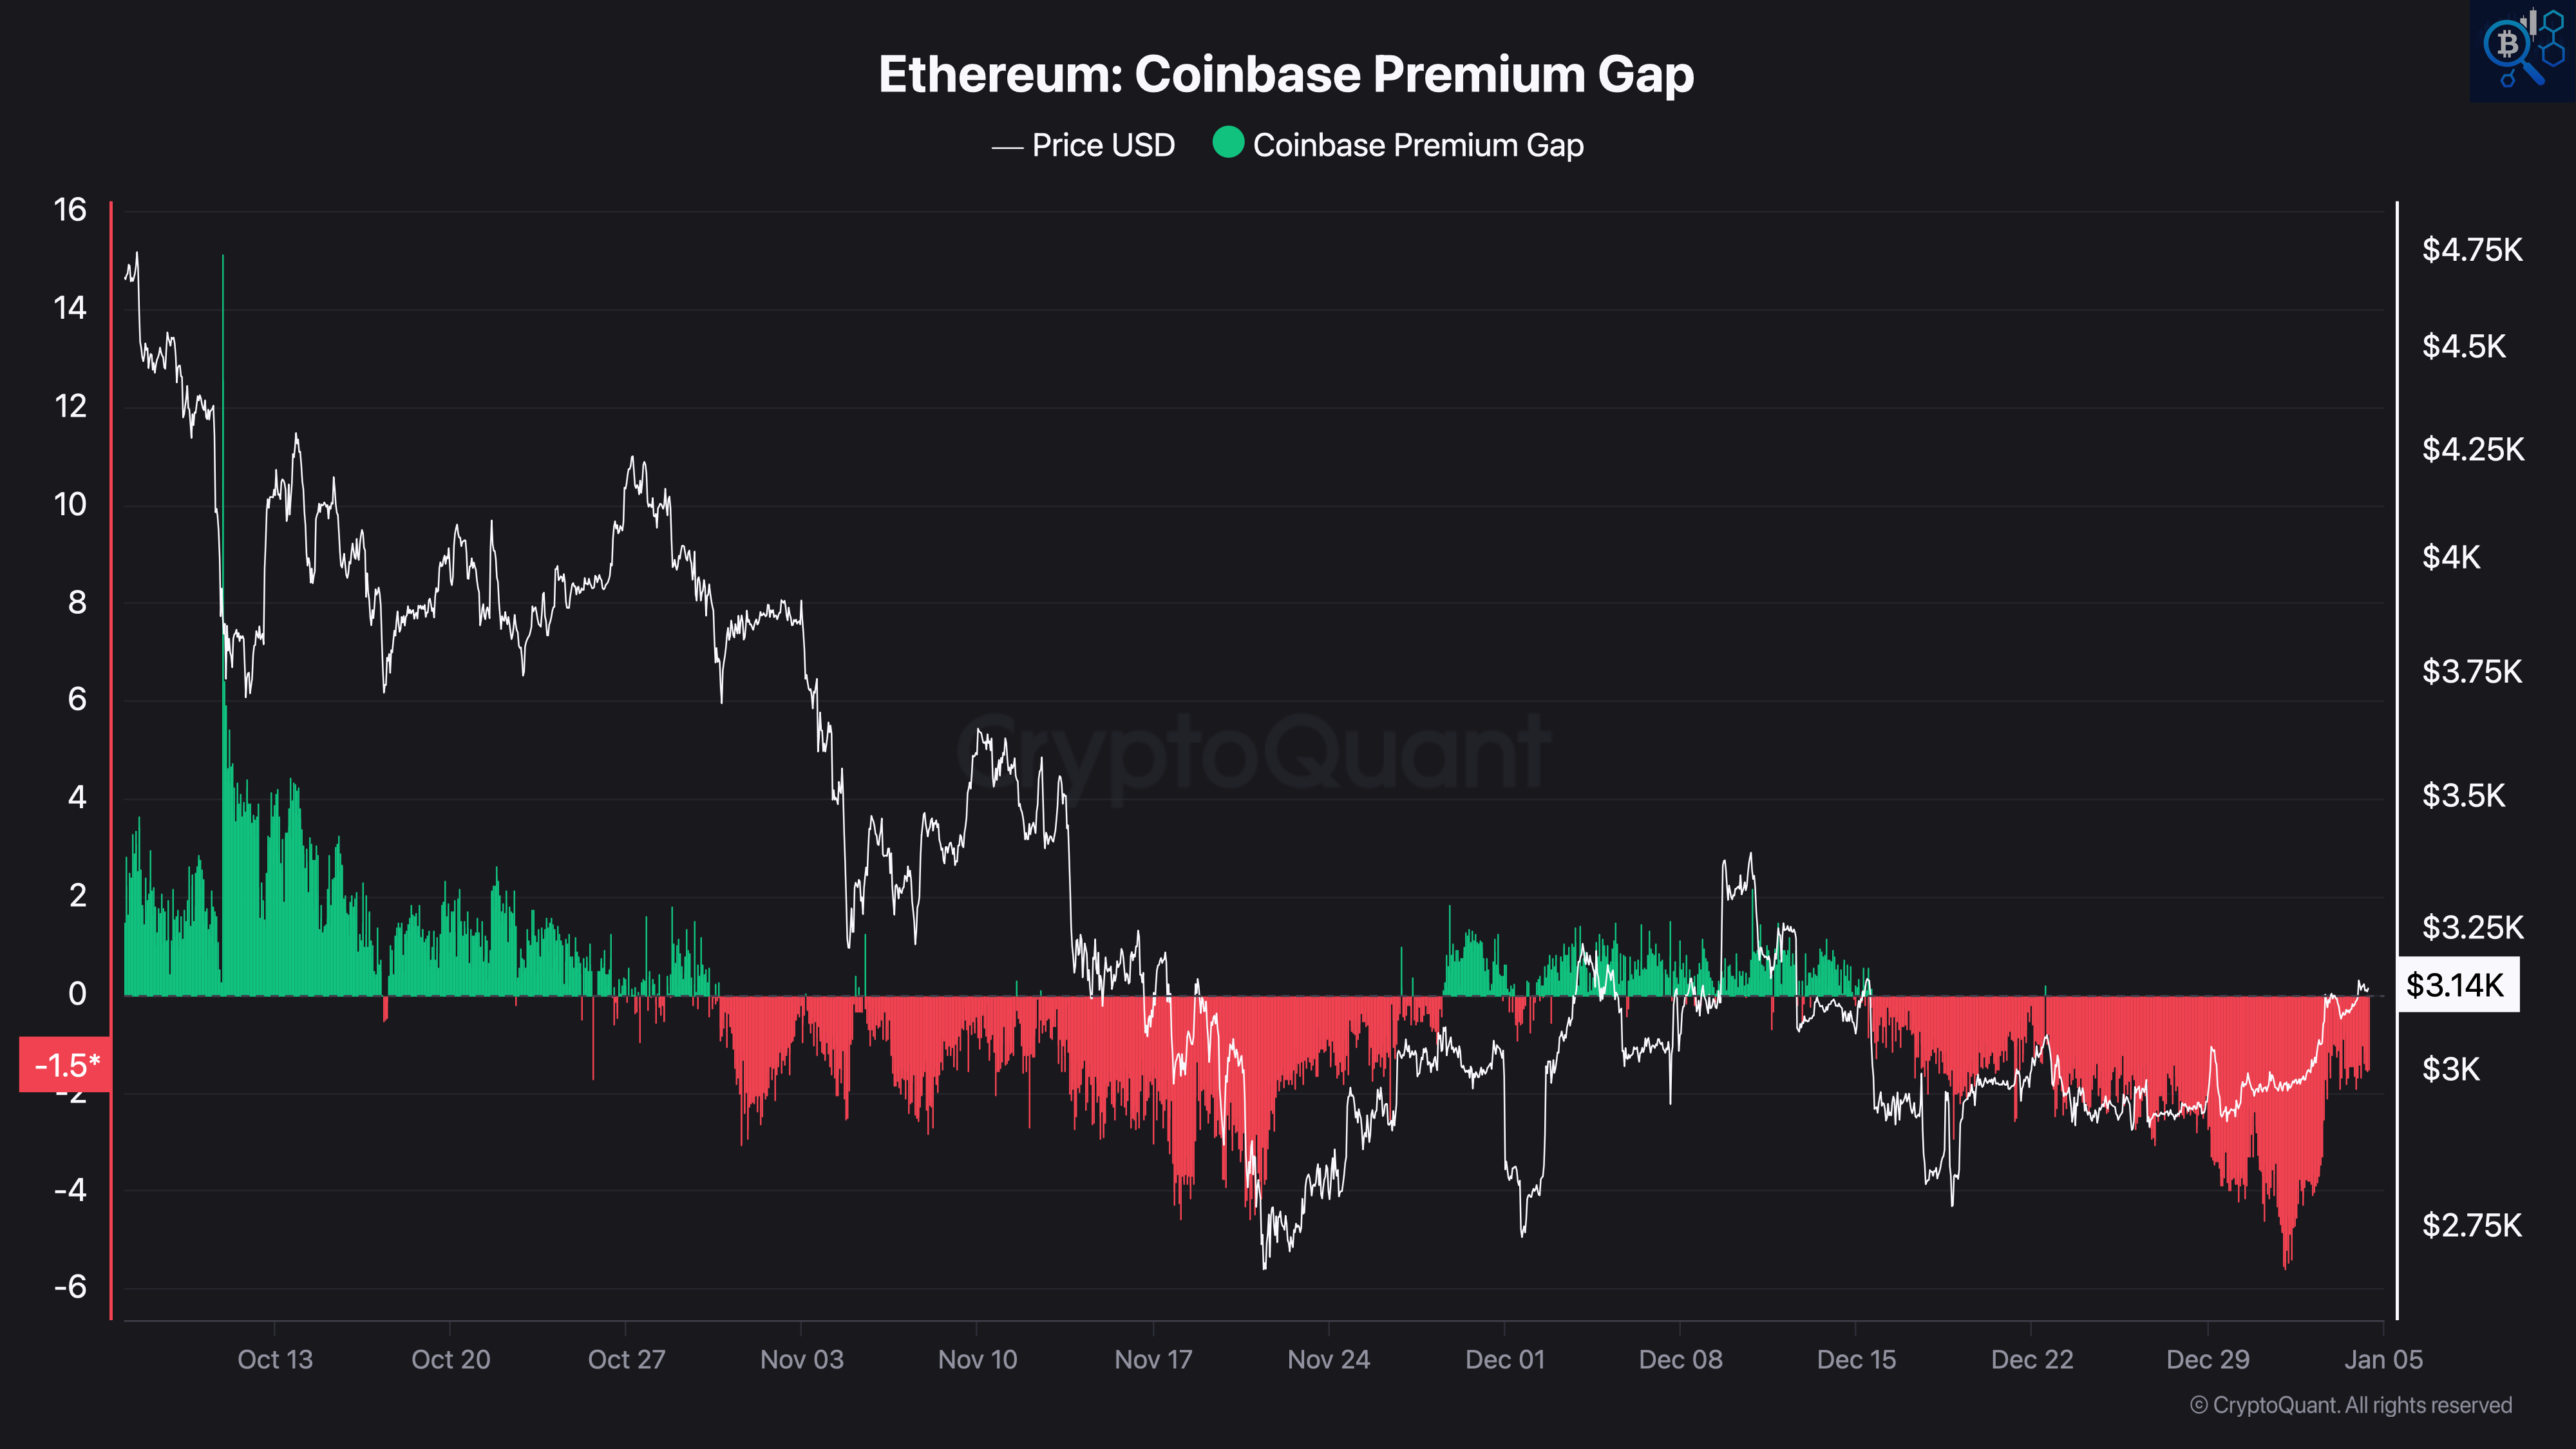
Ethereum: Coinbase Premium Gap
ETH displays a similar but weaker profile. The Coinbase Premium Gap has spent most of the period below zero, with only brief and shallow positive excursions that failed to persist. Even during ETH’s relative outperformance, the premium did not establish a durable positive regime.
This indicates that ETH’s strength is not underpinned by consistent U.S. spot participation, making recent advances more dependent on tactical flows and leverage elsewhere. Structurally, this leaves ETH more exposed to pullbacks when momentum slows.
Demand Context Summary:
BTC premium: negative and unstable
ETH premium: persistently negative, weaker than BTC
U.S. spot participation: reactive rather than leading
Recent rallies: lacking confirmation from Coinbase flows
U.S. spot demand is not acting as a primary driver of this market phase.
💬 Comment:
The Coinbase Premium Gap continues to provide important context for interpreting recent price action. Without sustained positive premiums, advances in both BTC and ETH lack one of the key characteristics seen during durable expansion phases. Until U.S. spot demand becomes consistent and persistent, price strength is best viewed as corrective and fragile, fitting a broader environment of consolidation or distribution rather than a renewed impulsive advance.
Want the next heads-up in real time? Follow @IT_Tech_PL on X and smash the 🔔 to stay in the loop.
9. 🔐 Bitcoin and Ethereum Spot ETF Flows - Weekly Overview.
Weekly Overview:
ETF flows have improved but remain uneven, supporting stabilization rather than a renewed expansion phase.
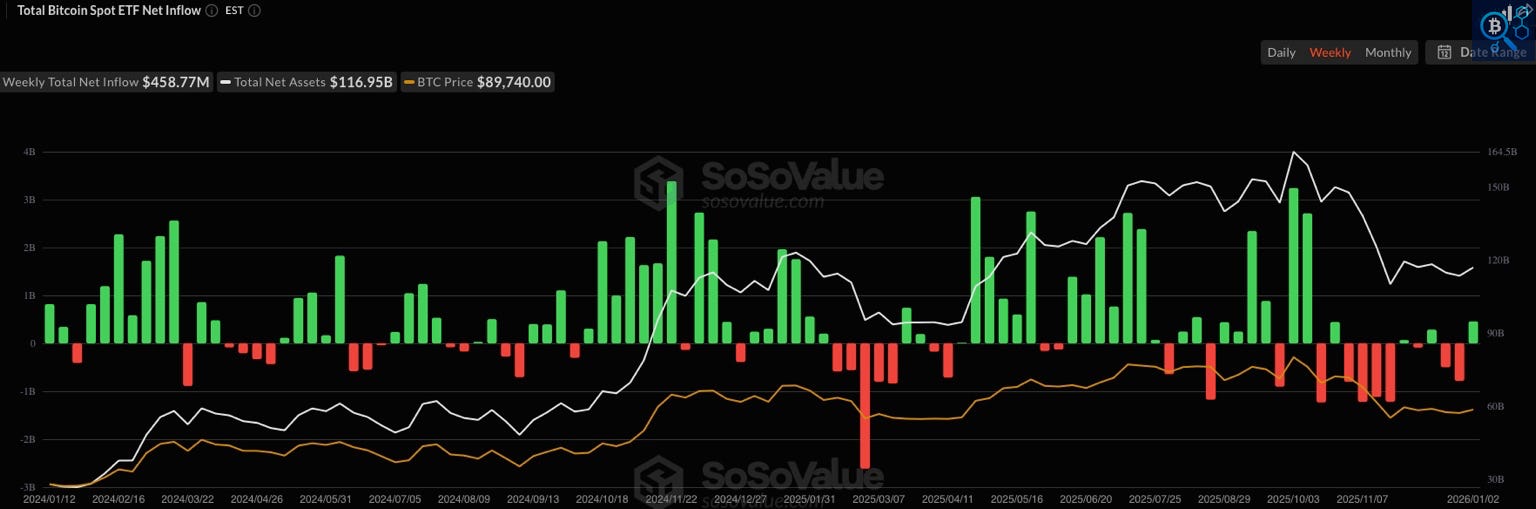
Bitcoin Spot ETFs
BTC spot ETFs saw ~$459M in weekly net inflows, lifting total assets to around $117B, with BTC trading near $89–90K. After recent outflows, this marks a shift toward stabilization. However, inflows are intermittent rather than persistent, unlike earlier accumulation phases. ETFs currently act as a supportive bid, not a primary driver of price.
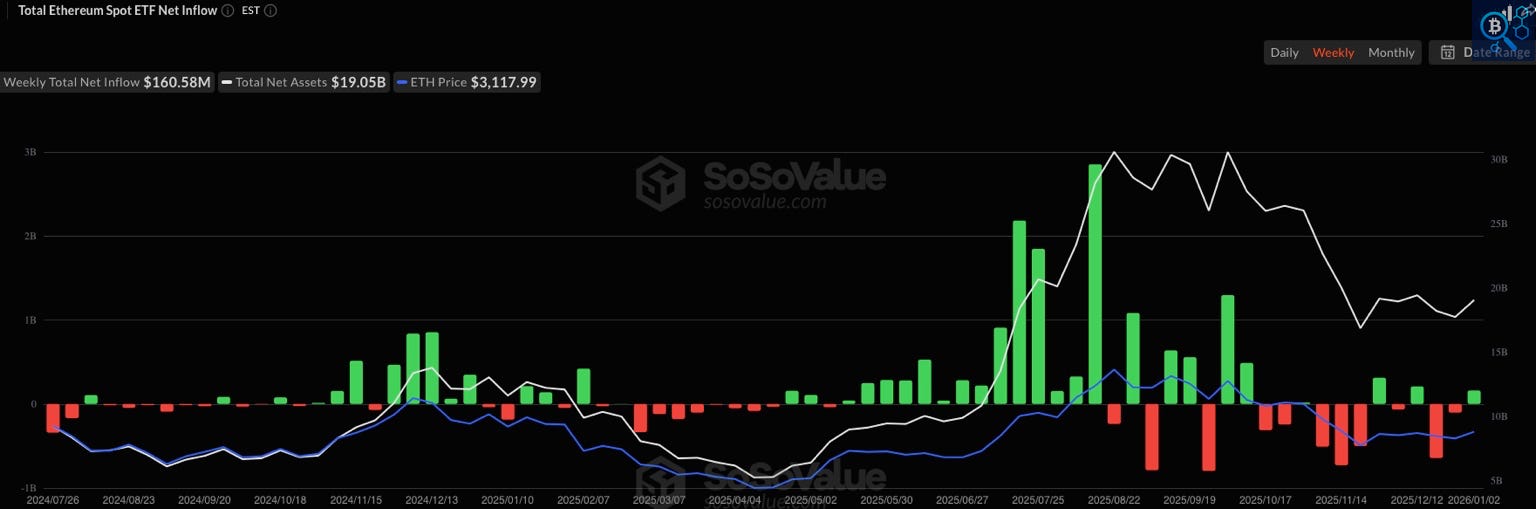
Ethereum Spot ETFs
ETH spot ETFs recorded ~$161M in weekly net inflows, with total assets near $19B and ETH around $3.1K. Flow patterns remain volatile, with positive weeks often followed by outflows, suggesting tactical positioning rather than conviction-based accumulation.
Flow Context:
BTC ETFs: stabilizing after drawdowns, no sustained inflow streak
ETH ETFs: inconsistent, reactive to price
ETFs overall: supportive, not decisive
💬 Comment:
The return of net inflows helps explain why BTC and ETH are holding key support levels, but the absence of sustained accumulation limits upside durability. Until ETF demand becomes consistent across multiple weeks, price strength remains fragile and aligned with a broader range-bound, late-cycle environment.
⚡ Note: Retail participation in this cycle appears mainly through ETF products rather than spot exchanges. This shift creates the illusion of a purely institutional rally, while in reality, part of the inflows come from smaller investors entering via brokerage accounts and retirement funds. This dynamic helps explain why spot exchange activity remains muted despite strong price performance.
From a structural perspective, this composition makes inflows more stable and less sentiment-driven, reducing short-term volatility, but it also means rallies may unfold more gradually, without the explosive FOMO typical of past retail-led cycles.
10. 🔐 Stablecoins Market Overview.
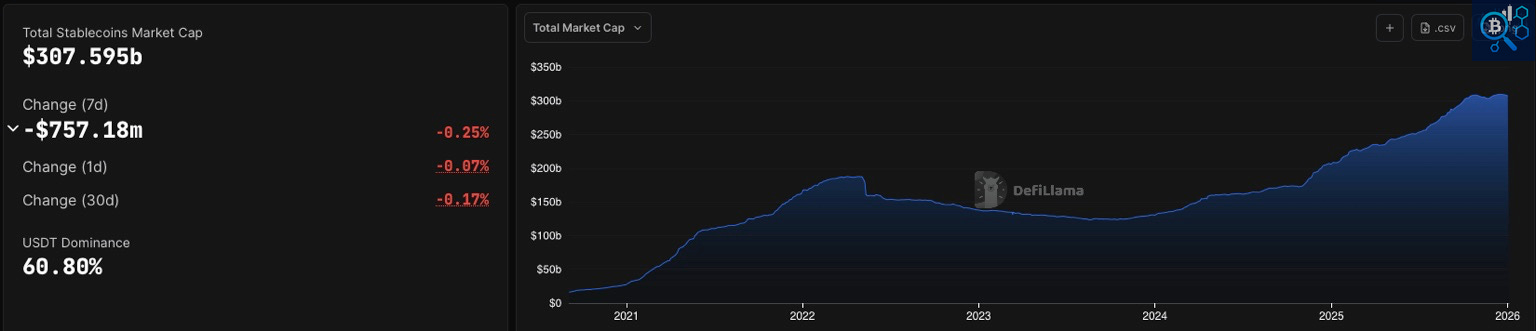
💵 Stablecoin Liquidity Monitor - Live chart
Stablecoin liquidity has stalled and slightly contracted, supporting consolidation rather than renewed risk-on behavior.
Current state:
Total stablecoin market cap: $307.6B
7D change: −$0.76B (−0.25%)
1D change: −0.07%
30D change: −0.17%
USDT dominance: 60.8%
Analysis:
After months of steady expansion, stablecoin supply has flattened and turned marginally negative across short timeframes. While the drawdown is modest, it marks a pause in liquidity growth rather than continued rebuilding of dry powder. USDT dominance remains elevated above 60%, indicating that liquidity is still concentrated in defensive rails rather than rotating aggressively into risk.
This configuration is consistent with a range-bound, late-cycle environment. Liquidity is sufficient to support price stabilization, but not expanding fast enough to fuel a broad risk-on phase or sustained altcoin upside.
💬 Comment:
As long as stablecoin supply fails to resume clear 30-day growth, the market backdrop remains neutral-to-defensive. A renewed expansion would improve upside durability, while further contraction would reinforce de-risking and downside fragility across BTC and especially altcoins.
11. 🔐 Newsletter Issue Summary.
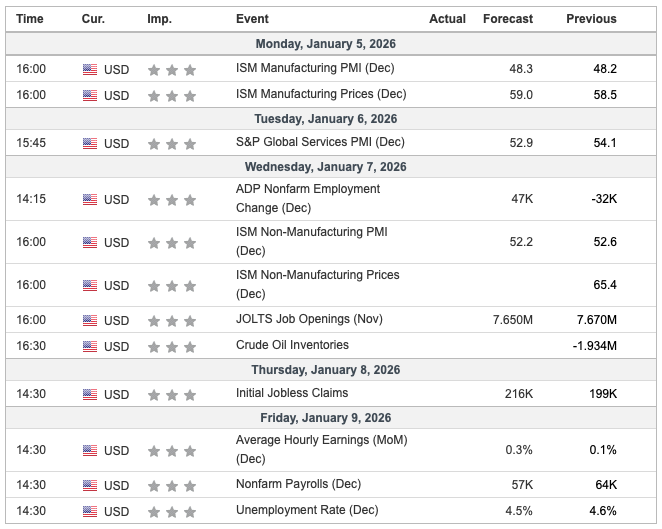
12. 🔐🔮 Forecast for the Upcoming Week.
Stay alert and monitor key indicators for deeper market insights. Monitor key indicators and upcoming US events.
Remember to realize profits regularly.💡That wraps up this issue. Have a great end to your weekend and an even better week ahead!
If you found this article helpful, leave a like 💙 comment and share it on your social media. 🤝
The next issue will arrive next Sunday - check your inbox and spam folder!
Disclaimer. This article reflects my personal views and is not investment advice. Cryptocurrency investments carry high risk. It includes mentions of affiliate links that may benefit the author.
Best regards
IT Tech
🎥 YouTube Channels + Website Launch.
After years of publishing on-chain research and growing the Polish IT Tech channel, I’m taking the next step.
1️⃣ New English YouTube Channel - Onchain_Insights by IT Tech
2️⃣ I reactivated my Polish YouTube channel.
3️⃣ New Website – btc-analysis.com
This is now the main hub for everything I publish:
Weekly Crypto Market Reports
On-chain dashboards - free for all
YouTube videos
Telegram & X links
Premium access and resources
The goal is simple - one link, all my content, updated in real time.
Table of contents:
🆓 Free content (for all free subscribers):
Top 10 Crypto & Macroeconomic News
Current market situation
New Telegram community for Active Traders
🔐 Premium Insights (exclusive for paid subscribers):
📺 Video version summary included 📺BTC & ETH Market Overview: Spot & Futures Market Signals
Selective Leadership in a Fragmented Market
Realized Price & Short-Term Holder Stress: Key Cost Basis Levels in Play
Behind the Price: What Whales and Dolphins Reveal
U.S. Spot Demand: Coinbase Premium
Bitcoin and Ethereum Spot ETF Flows - Weekly Overview
Stablecoins Market Overview
Newsletter issue summary
Forecast for the Upcoming Week
Macro & Market News Recap (Dec 29, 2025 – Jan 4, 2026):
The holiday-shortened week closed out a volatile 2025 and opened 2026 with mixed but stabilizing signals across macro, equities, and crypto.
In crypto, 2025 ended net-negative after an early-year policy-driven surge and a sharp late-year crash. Bitcoin finished the year well below cycle highs and entered 2026 stabilizing around $89K–$90K, with volatility compressed and price coiling. The dominant narrative going into 2026 has shifted away from euphoria toward capital preservation, institutional adoption, and selective use cases such as ETFs, tokenization, and DeFi infrastructure.
Early 2026 trading saw BTC briefly push above $90K, supported more by holiday liquidity than conviction flows. Volatility expansion risk is rising after weeks of compression, while crypto-linked equities staged a modest rebound following December’s selloff.
U.S. equities started 2026 on a firmer note. The Dow and S&P 500 snapped a four-day losing streak, led by semiconductors, while the Nasdaq lagged slightly. This comes after a strong 2025 overall: the S&P 500 closed the year up over 16%, marking a third consecutive year of double-digit gains despite a weak December and no Santa Claus rally.
Looking ahead, the Wall Street consensus is unusually aligned. Major strategists broadly expect U.S. equities to rise again in 2026, with S&P 500 targets clustering near 7,900–8,000, driven by AI-led earnings growth and expectations of gradual Fed easing.
On the policy front, Federal Reserve minutes reinforced a cautious stance. Officials remain divided on further rate cuts, with inflation risks still present. Projections point to stronger GDP growth (~2.3%) but limited easing, potentially just one cut in 2026. January labor market data is now the key catalyst.
In FX and commodities, the U.S. dollar firmed to start 2026 after its sharpest annual decline in eight years, while gold and silver rebounded from late-December pullbacks, finishing 2025 as relative outperformers.
Longer-term crypto forecasts for 2026 remain polarized. Institutional adoption, additional spot ETFs, and stablecoin expansion are cited as structural positives, while deep drawdown risk persists in speculative, retail-heavy tokens if liquidity tightens.
💬 Comment:
Entering 2026, markets are stable but far from complacent. Equities reflect confidence in earnings and policy normalization, while crypto remains in a repair and re-assessment phase rather than a renewed expansion. With volatility compressed and expectations elevated, the next leg will likely be driven by data confirmation rather than narrative momentum. This environment favors patience, selectivity, and a focus on structure and flows over headline-driven positioning.
2. Current market situation.
Market Structure (1W Overview):
Weekly structure still reflects a fragile bounce inside a damaged, late-cycle regime. BTC is stabilizing above support but remains capped below major resistance, dominance stays elevated, and altcoins remain structurally weak.
Weekly structure remains heavy: BTC is holding above the 90K support band but trades well below the broken 95K–100K zone, dominance sits near 60%, and the broader altcoin market shows no clear leadership.
Bitcoin at ~$91.4K (up w/w), bounce still capped below 95K–100K
This week’s range was roughly 86.8K–91.8K. Price managed a modest rebound from the recent lows but failed to reclaim the low-90K area decisively and remains well below the broken 95K–100K support zone and the 120K–126K cycle peak. Recent weekly candles continue to form a consolidation after the sharp drop from the highs, not a reversal structure. The 80K–85K region remains the key downside support, while 95K–100K is the first meaningful resistance band. Below it, the move off the lows still looks like stabilization and repair rather than a renewed impulse.
BTC.D at ~59.2% (slightly down w/w), dominance elevated and sticky
Dominance traded roughly between 58.8% and 60.5% and closed near the middle of the range. The broader trend since 2023 remains up, despite the pullback from the ~66% peak. Capital remains concentrated in BTC, and the lack of a decisive breakdown in dominance suggests that any altcoin strength continues to be rotational and short-lived rather than the start of a sustained altseason.
TOTAL at ~$3.09T (up w/w), holding above 3.0T but below key pivots
Total crypto market cap ranged roughly between 2.91T and 3.17T and finished just above 3.0T. While the bounce from the lows is constructive in the very short term, TOTAL remains clearly below the 3.2T–3.3T breakdown zone and far from the 4.0T–4.3T distribution peak. As long as 3.2T–3.3T is not reclaimed, the broader backdrop remains corrective, with the 3.0T area acting as a fragile floor rather than a launchpad.
OTHERS at ~$220B (up w/w), altcoin basket still weak
The OTHERS index traded between roughly 197B and 223B and closed near 220B. Despite the bounce, it remains structurally weak, far below the 451B cycle high, and continues to print lower highs within a broad range. Altcoins remain the weakest segment of the market. Recent strength looks more like a technical rebound from support than the start of a trend change, with liquidity still thin and rallies vulnerable to selling.
Structure: BROKEN, SIDEWAYS CONSOLIDATION BELOW RESISTANCE
💬 Comment:
With BTC still below the 95K–100K resistance zone, TOTAL capped under 3.2T, and dominance holding near 60%, the weekly structure continues to favor a defensive stance. The rebound from the 80K area has evolved into sideways consolidation rather than a new bullish leg, while altcoins remain fragile and range-bound. Until BTC can reclaim and hold above 95K–100K on a weekly close and OTHERS begin forming sustained higher lows, the base case remains late-cycle distribution or early bear conditions, characterized by choppy price action and limited upside follow-through.
")
Crypto Heatmap TOP 300 (7D): Broad red, weak breadth, no clear leadership
The heatmap shows a risk-off week across the board: majors are red, altcoins are broadly under pressure, and green pockets are isolated and short-lived.
Majors are firmly negative:
BTC is down around −1.9%, ETH roughly −4.1%, with SOL, BNB, XRP, and DOGE all posting mid to high single-digit losses. There are no large-cap leaders absorbing risk. Majors are not acting as safe havens; they are participating in the downside.
Breadth clearly bearish:
The vast majority of the top 300 is red, with losses spread across sectors and market caps. Green tiles are sparse and mostly small, indicating weak participation and poor follow-through. This is not selective rotation; it is broad de-risking.
Altcoins hit harder than BTC:
Mid- and lower-cap alts show deeper drawdowns, many in the −10% to −25% range. Liquidity looks thin, and sell pressure dominates across DeFi, L2s, infra, and memecoins alike. Any short-term bounces are quickly sold.
No sector leadership:
Unlike constructive consolidations, where one or two sectors hold green, this map lacks a clear theme. Even traditionally defensive or narrative-driven areas fail to sustain gains, reinforcing the view that capital is exiting risk rather than rotating within crypto.
💬 Comment:
This 7-day heatmap confirms the weekly structure: downside pressure is broad-based, participation is weak, and there is no emerging leadership. With BTC below key resistance and dominance still elevated, altcoins remain vulnerable and act as the release valve for risk. Until the heatmap starts showing sustained green clusters and sector leadership, conditions favor capital preservation and tactical trading, not accumulation.
3. New Telegram Community for Active Traders.
New! IT Tech Trading Setups group is now live.
Every weekday: Bitcoin and Ethereum trading setups based on liquidation levels, market structure, and momentum.
3-5 setups per week
Entry, Stop Loss, and Take Profit are all pre-calculated
No clickbait, just clean executions
Free tools that help you trade better
You can now join the group in two ways:
BingX (with KYC):
Register: bingx.com/partner/ITTECHPL
Complete KYC, deposit ≥ 100 USDT, and place 1 trade > $100
DM the bot: @IT_Tech_Trading_Setup_Bot → instant invite ✅
BloFin (no KYC, UK and US can also trade):
Register: partner.blofin.com/d/ITTech
Deposit ≥ 100 USDT and place 1 trade ≥ $100
Fill the 60-sec form: Google Form – access within 24h
🎁 Why join now?
⚡ Fresh setups drop weekdays only - structured, not FOMO
⚡ Liquidation maps + on-chain context included
⚡ Real methodology, 56.2% proven edge
Pick your exchange, lock in the bonus, and trade with me. See you inside! 🔥*Disclaimer: Educational content only. Not investment advice. Past performance does not guarantee future results.
🔐 Premium Insights (exclusive for paid subscribers).
🧠 Still using only the free version? You’re missing half the picture. Let’s deep dive into on-chain data and check what is driving the Bitcoin and crypto market.
Already subscribed? Scroll down to continue reading or watching the video version.
📺 Video version: Premium subscribers now get access to a full video version summary of each issue. Watch and stay ahead with deep on-chain insights.
Keep reading with a 7-day free trial
Subscribe to On-Chain Insights by IT Tech💡🧠 to keep reading this post and get 7 days of free access to the full post archives.