
Bitcoin and Crypto Market Report - Week 25 #182
Bitcoin ETFs Are Now Negative Year-to-Date for the First Time Since Launch.

Six straight weeks of Bitcoin ETF outflows. Zero positive Coinbase Premium hours for the fourth week running. For the first time since launch, Bitcoin ETFs are now negative year-to-date. Welcome to the 182nd issue of On-chain Insights by IT Tech.
This Week in On-Chain:
Bitcoin fell another 2.58% this week and is now 49.3% below its all-time high - and far fewer crypto sectors are in the green: only 7 out of 24, down sharply from 16 last week
US investors aren’t buying: Bitcoin and Ethereum traded cheaper on the main US exchange than everywhere else, for the entire week - the fourth week in a row this has happened
For the first time since Bitcoin ETFs launched in 2024, more money has left them than entered them this year overall - not just in one bad week, the whole year so far
Holders flipped between profit and loss six times in two weeks - a pattern that has shown up before every major bottom in past cycles, but historically only as the opening stage, not the finish line
Bitcoin briefly climbed back above the average price ETF buyers paid in May, but lost that ground again in early June and is still below it
The total supply of stablecoins (dollar-pegged crypto used to buy and sell other coins) shrank by $7.25 billion this month - a sign money is leaving crypto altogether, not just sitting on the sidelines
🔗 Stay Connected:
🎥 YouTube: Onchain_Insights - English | IT Tech PL - Polish | Hub: btc-analysis.com

New Telegram Community for Active Traders.
I share structured Bitcoin and Ethereum trade ideas aligned with the on-chain framework used in this report. Access is free via one of the partner exchanges.
Bybit.eu 🇪🇺 EU users (EEA) - claim up to 40 USD 🎁 in BTC
Bybit.com 🌍 Rest of world - claim up to 40 USD 🎁 in BTC
BloFin (no KYC, available also in the US & UK)
👉 Full instructions and access:
*Disclaimer: Educational content only. Not investment advice. Past performance does not guarantee future results.
Top 10 Market News: Crypto, Stocks & Macro (June 15-21, 2026).
The week's dominant story was geopolitical: a US-Iran ceasefire announced mid-week triggered a broad risk-on rally that briefly lifted Bitcoin to two-month highs, before a hawkish-leaning Fed under new Chair Kevin Warsh pulled risk appetite back into consolidation.
US-Iran Ceasefire Crushes Oil, Lifts Risk Assets - A deal to end the conflict and reopen the Strait of Hormuz sent Brent crude to its lowest level since early March. Equities and crypto rallied sharply on June 15 as geopolitical risk premiums came out of the market.
Dow Hits Record Close, Nasdaq Leads Tech Rally - The Dow closed near 51,671 (+0.92%), the S&P 500 gained 1.65% to roughly 7,554, and the Nasdaq jumped 3.07% to about 26,684. Chip and tech names led the move as lower oil prices reduced inflation concerns.
SpaceX IPO Reshapes Market Cap Rankings - Following a record $75B IPO, SpaceX shares surged more than 20% on June 15 and kept climbing, briefly pushing the company’s valuation above Amazon’s toward the $2T mark. Tokenized versions of the stock saw execution issues on some crypto trading platforms.
Fed Holds Rates, Signals Hawkish Tilt Under Warsh - The FOMC kept rates unchanged at 3.5-3.75% in a 12-0 vote at Kevin Warsh’s first meeting as Chair. Projections hinted at the possibility of hikes later in 2026, citing resilient growth, a solid labor market, and an energy-driven CPI uptick.
BTC Rallies to $66-67K, Then Fades to ~$64K - Bitcoin spiked on ceasefire optimism, reaching intraday highs near $66-67K around June 15-16, before consolidating lower through the week as the Fed’s tone shifted sentiment. ETH and select altcoins outperformed BTC on a short-term basis.
Mid-Week Rotation Out of Tech - The Dow extended its record run early in the week, briefly trading above 52,000 intraday, while Nasdaq and tech names saw rotation and partial profit-taking. SpaceX remained the dominant single-stock story throughout.
Macro Resilience Pushes Out Rate Cut Expectations - US economic data showed continued strength in jobs and broader activity, but energy-driven inflation kept the Fed cautious. The IMF flagged no imminent global slowdown, though risks remain on the table.
Crypto-Specific Crosscurrents - The week also saw scheduled token unlocks, continued ETF flow activity, ongoing stablecoin regulation discussion, and an Ethereum bot exploit. Strategy (formerly MicroStrategy) continued adding to its BTC position despite the pullback.
Analysts Flag Near-Term Pullback Risk Despite Longer-Term Optimism - Commentary around AI-driven equity strength and SpaceX-fueled enthusiasm was tempered by warnings (including from Tom Lee) of a possible near-term S&P pullback, alongside caution around future large-cap IPO unlocks and persistent energy risk.
Tokenized Assets and Range-Bound BTC - SpaceX’s IPO hype extended into tokenized stock products on crypto platforms, with mixed execution quality. BTC held within a defined range relative to its prior peak as the broader macro picture remained mixed.
💬 Comment:
This was a week where macro briefly took the wheel - geopolitical de-risking and a record-setting equity rally pulled Bitcoin higher in lockstep with risk assets generally, only for a hawkish Fed reset under Warsh to cap the move. The pattern is consistent with macro acting as a catalyst for volatility rather than a driver of structural demand: BTC’s pullback from $66-67K back toward $64K happened even as equities stayed near records, suggesting crypto-specific positioning, not just risk sentiment, governed the retracement. None of this week’s headlines - ceasefire, Fed, or SpaceX - change what the on-chain data is showing about actual capital flows into or out of Bitcoin, and that remains the primary driver of this issue’s bias. With macro providing the backdrop, the price chart tells us where that uncertainty landed - and Section 3 shows exactly where structure held and where it broke.
General Market Update.
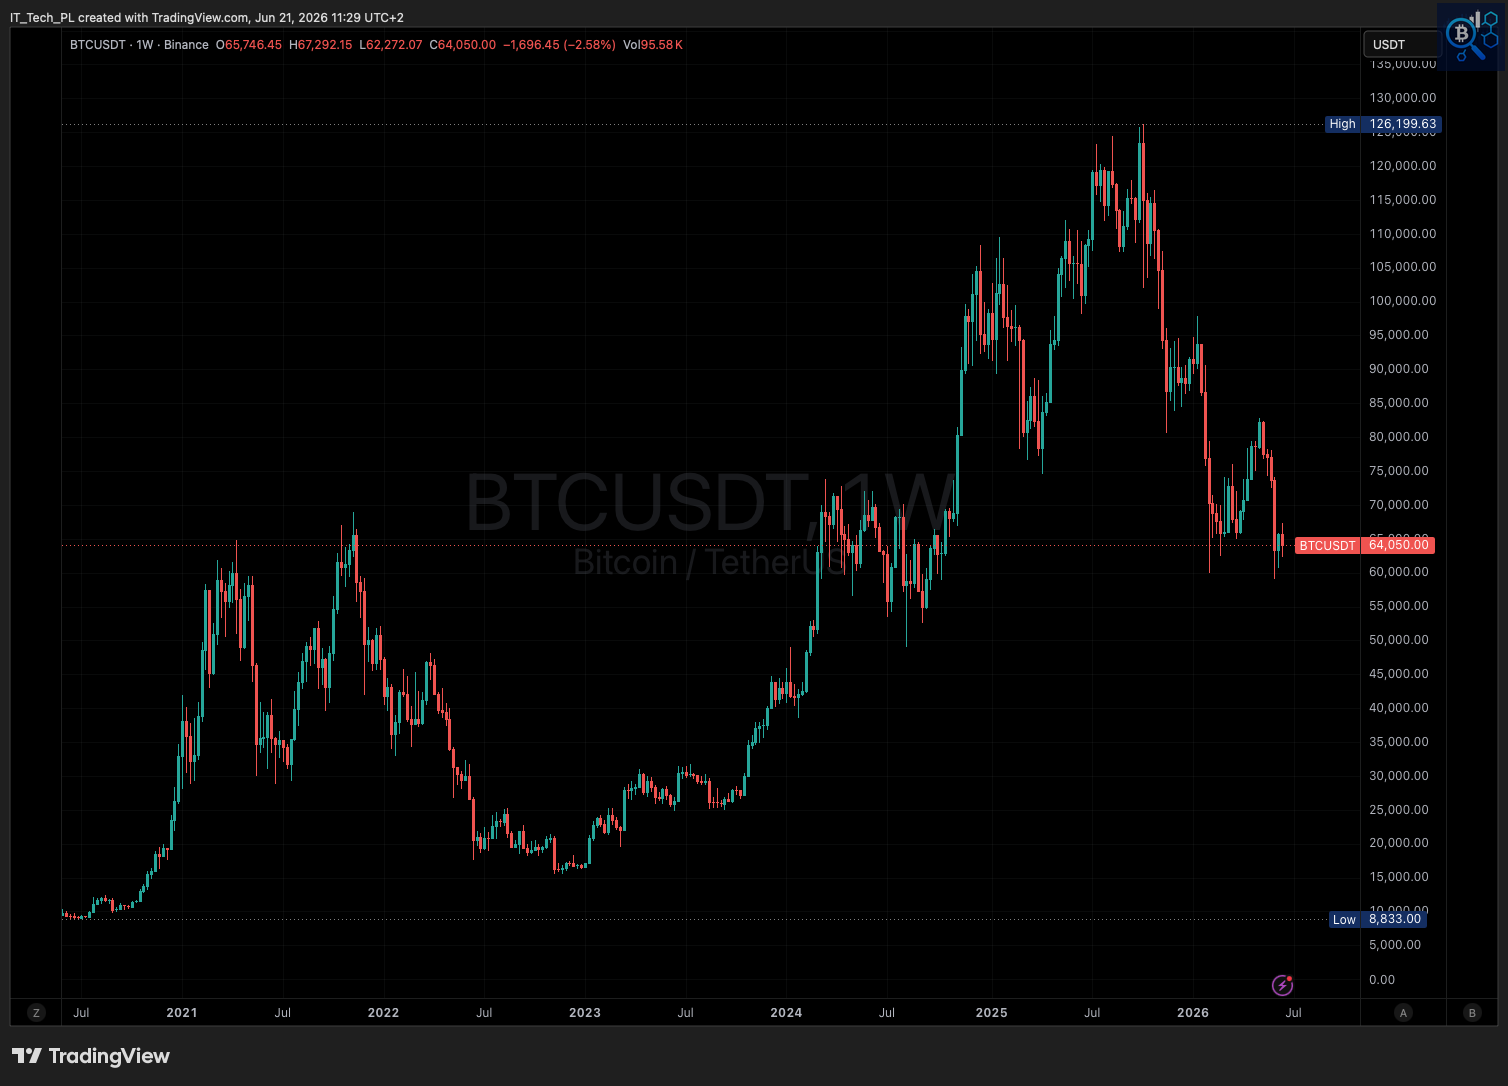
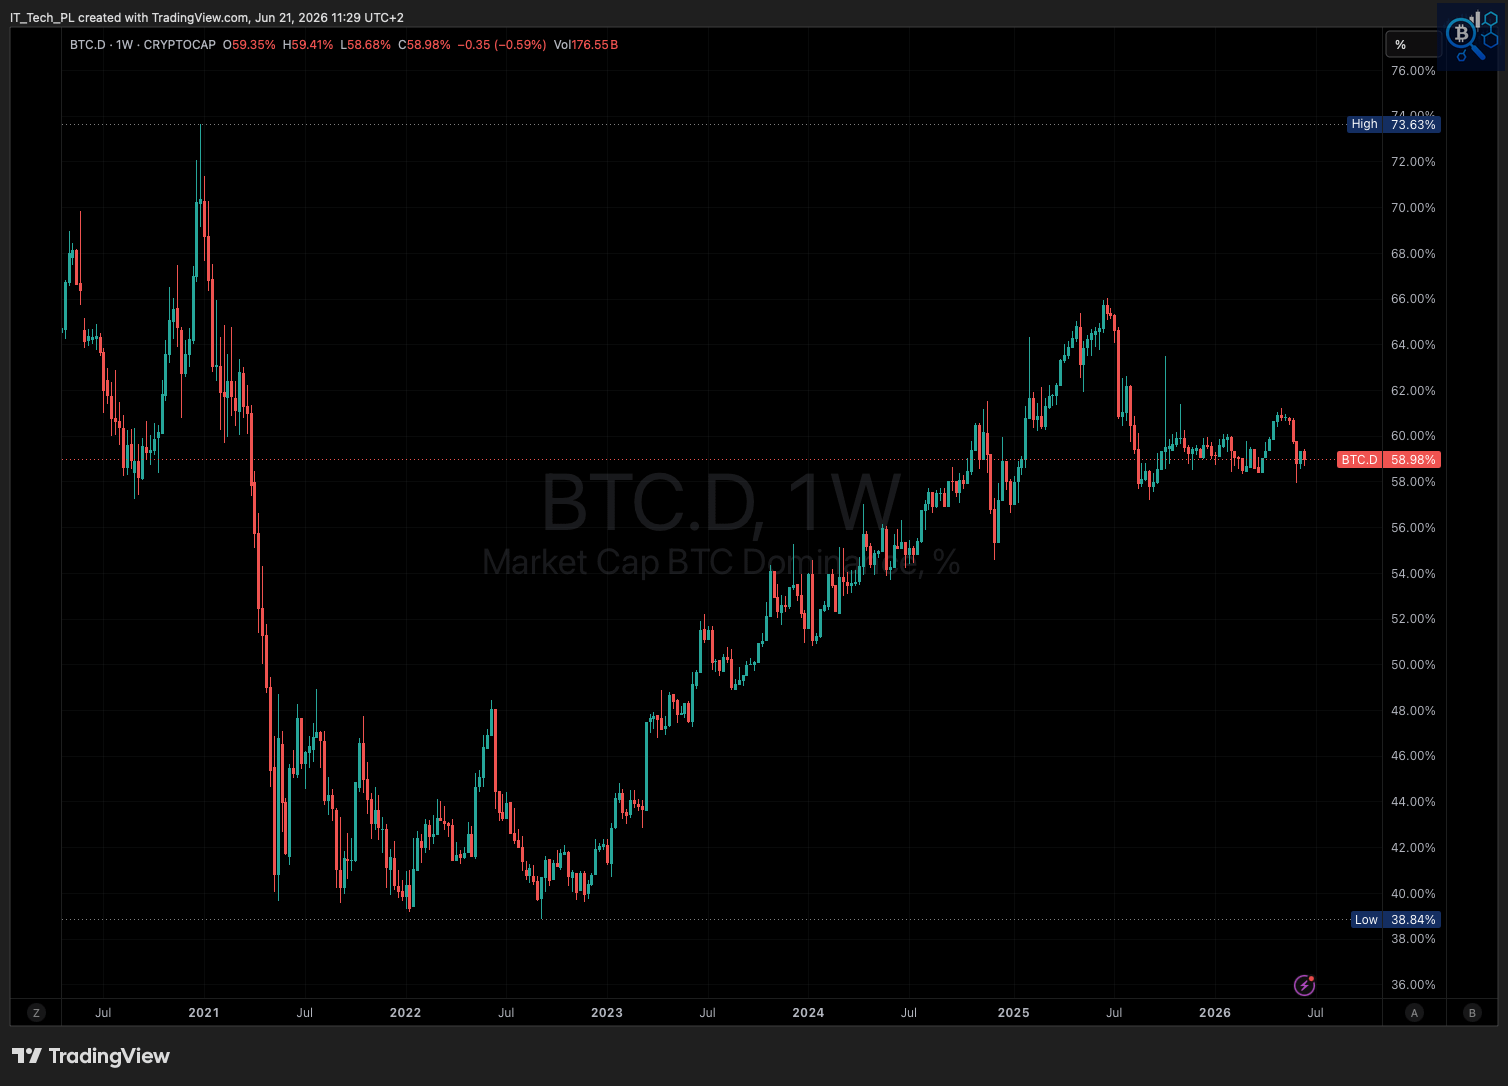
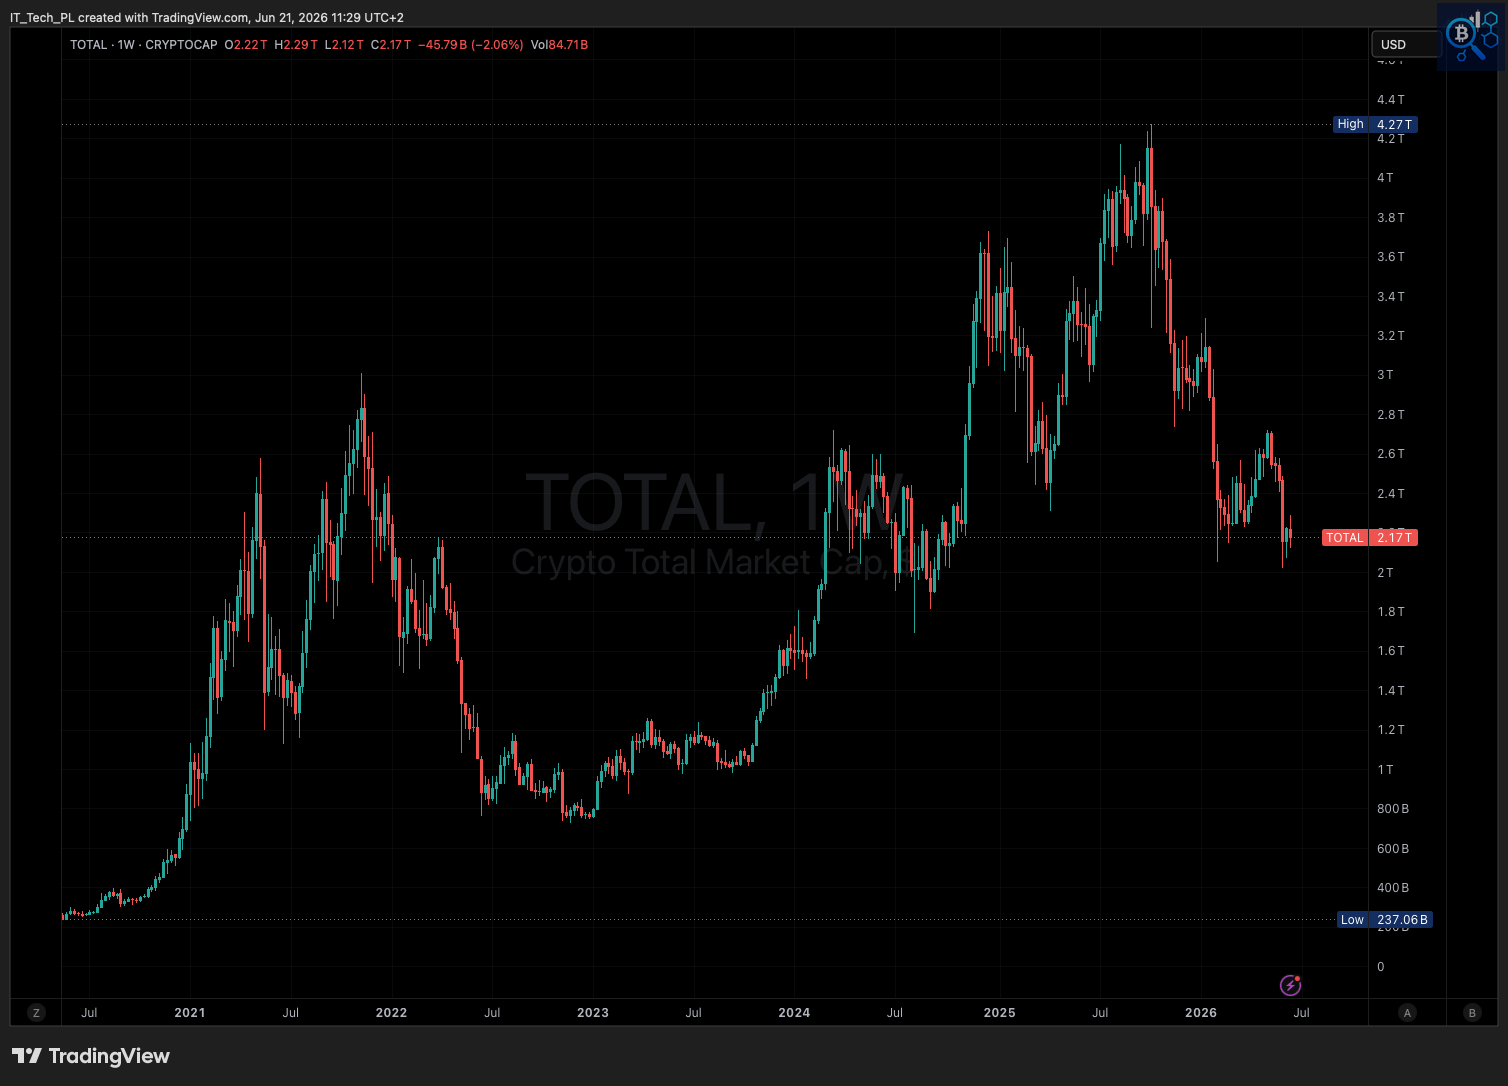
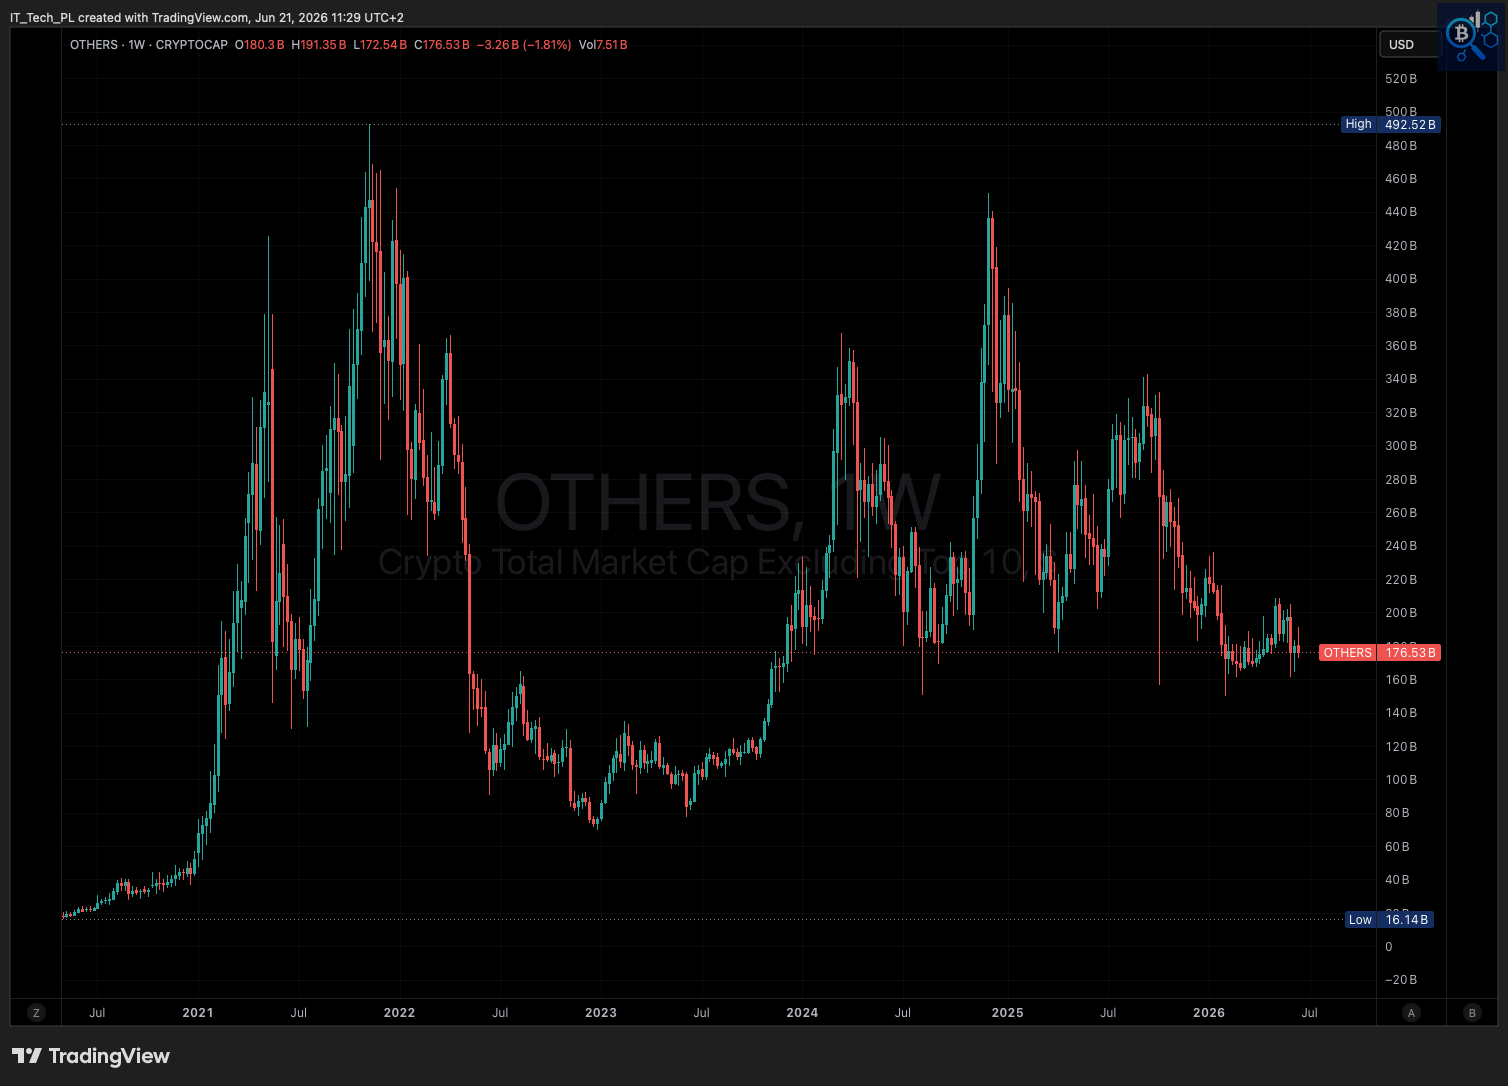
BTC is trading lower for a second consecutive week heading into Sunday's close, with the weekly candle still open - weakness is spreading further into altcoins than into Bitcoin itself, even as BTC.D holds its range rather than breaking down.
Current state:
BTC (1W, candle still open / at the time of writing - Sunday): High $67,292 | Current $64,050 | WoW -2.58% | ATH $126,200 (-49.3%)
BTC.D (1W, candle still open): Current 58.98% | WoW -0.59% | Cycle high 73.63% - well off the all-time high, holding a multi-month range between roughly 58% and 61%
TOTAL (1W, candle still open): Current $2.17T | WoW -2.06% | ATH $4.27T (-49.2%)
OTHERS (1W, candle still open): Current $176.53B | WoW -1.81% | ATH $492.52B (-64.2%)
Key levels:
BTC resistance: $67.3K (this week’s high) / $70K (rejection zone tested multiple times since early 2026) | BTC support: $62.3K (this week’s low) / $60K (former breakout level from Q4 2024)
TOTAL resistance: $2.29T (week high) / $2.4-2.6T (January-February 2026 consolidation shelf) | TOTAL support: $2.12T (week low) / $2T psychological level
OTHERS resistance: $191B (week high) / $200-220B (late 2025 consolidation shelf) | OTHERS support: $172.5B (week low) / prior range floor near $160B
💬 Comment:
BTC and TOTAL show nearly identical drawdowns from ATH (-49.3% and -49.2%), while OTHERS sits 64.2% below its peak - altcoin weakness remains structurally deeper, not a one-week move. BTC.D's flat -0.59% inside its 58-61% range confirms no rotation into alts: capital is sitting still or exiting, not chasing risk further out the curve. This points to continued de-risking rather than early-recovery breadth, figures still subject to change before the candle closes. Section 4 covers spot and futures order flow next - until BTC reclaims $67-70K on a sustained basis, the regime label remains Bear.
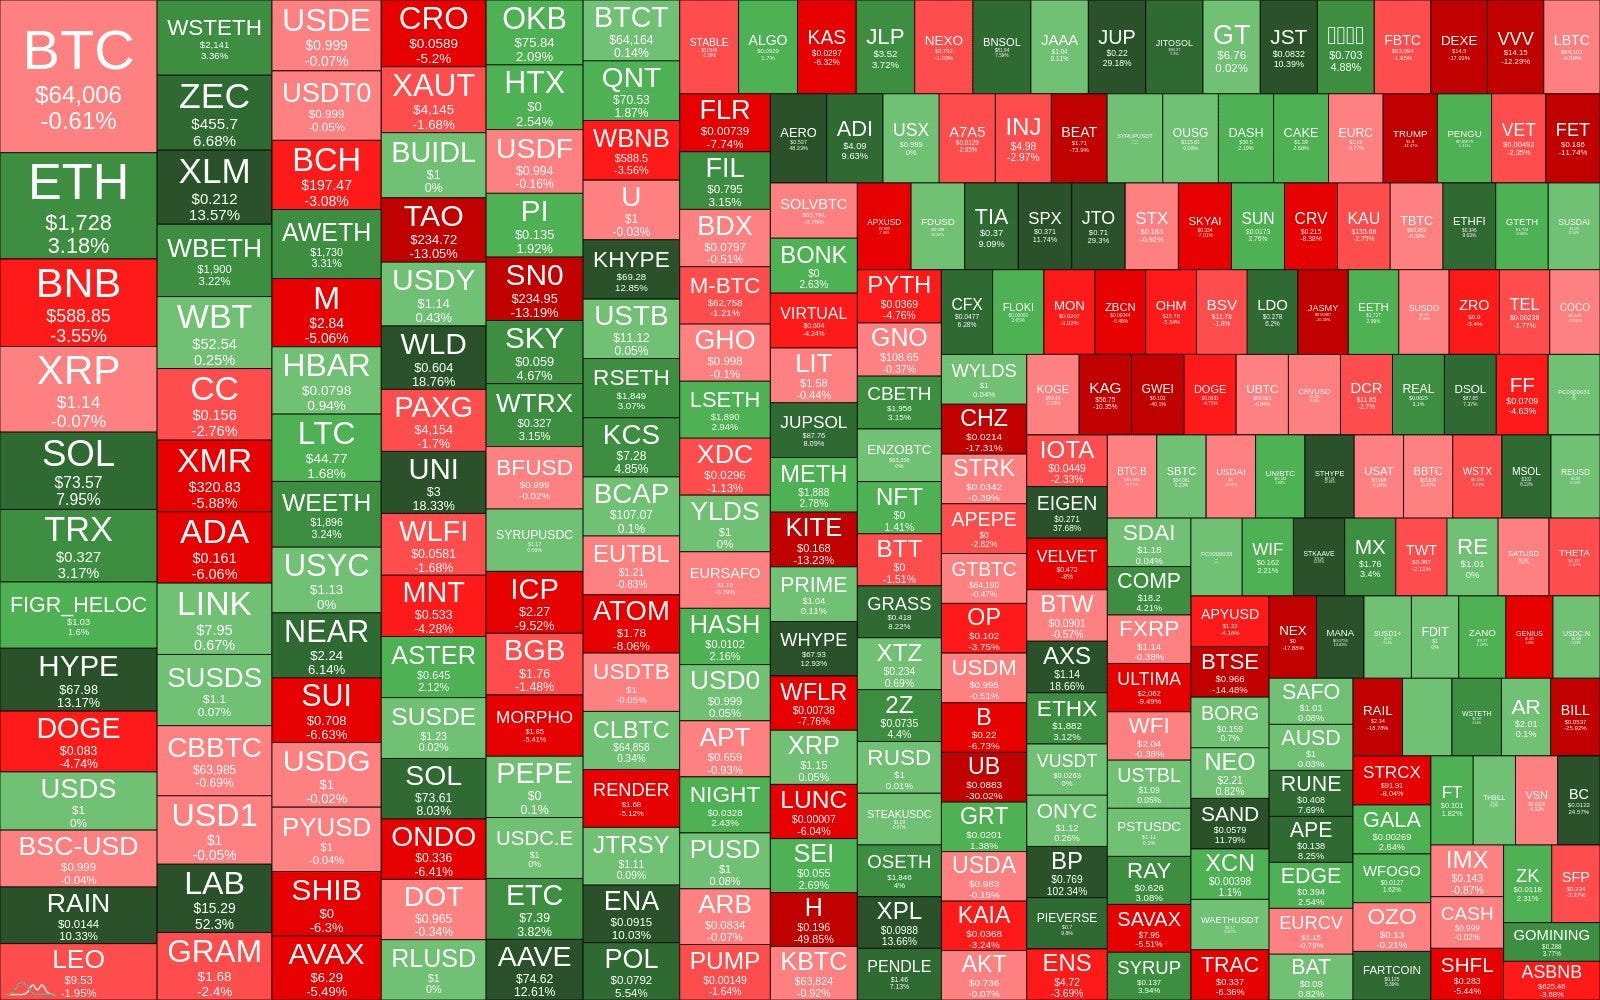
Crypto Heatmap TOP 300 Coins (7D).
The heatmap shows fragmented, idiosyncratic moves rather than a coordinated risk-on shift - isolated double-digit gainers sit next to red majors and red Layer-1s, with no sector acting as a unified leader.
Current state:
BTC: -0.61% ($64,006) | ETH: +3.18% ($1,728) - ETH outperforming BTC on a 7D basis
Majors: SOL +7.95%, BNB -3.55%, XRP -0.07%, ADA -6.06%
Notable green: WLD +18.76%, UNI +18.33%, HYPE +13.17% - isolated names, no sector clustering or follow-through
Infrastructure/L1: mixed - SOL +7.95%, NEAR +6.14% against TAO -13.05%, ICP -9.52%, ATOM -8.06%
💬 Comment:
ETH's outperformance against BTC (+3.18% vs -0.61%) is the one consistent reading among majors, but it isn't confirmed by the rest of the market - SOL is up nearly 8% while BNB and ADA are down mid-single to high-single digits, and the standout green names (WLD, UNI, HYPE) have no shared narrative or sector tying them together. The Layer-1 complex is internally split rather than trending as a group, with TAO and ICP posting some of the week's sharpest losses alongside SOL's strength - this is breadth without direction, not the broad expansion typically seen early in a recovery. Section 4 turns to spot, and futures order flow next. Until green clusters extend across full sectors for multiple consecutive weeks, isolated moves like these remain noise rather than rotation.
I built a free on-chain dashboard on CryptoQuant. Bitcoin macro metrics, NUPL, SOPR, STH cost basis, exchange flows, and much more - all in one place. No noise. Just the data I actually track.
Normal Orders, Neutral CVD: The Bounce That Left No Fingerprints.
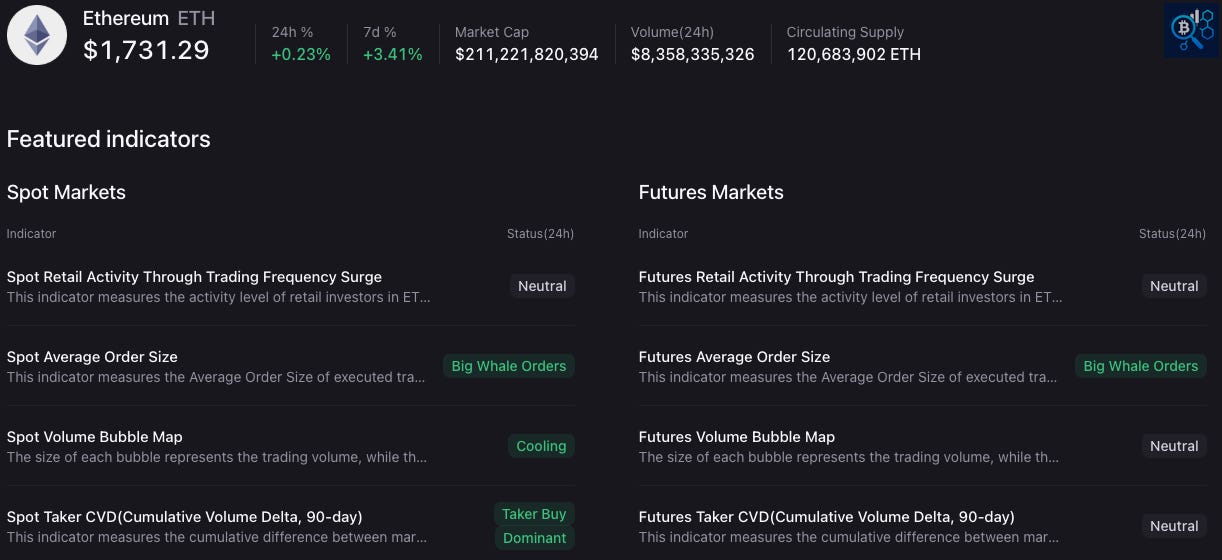
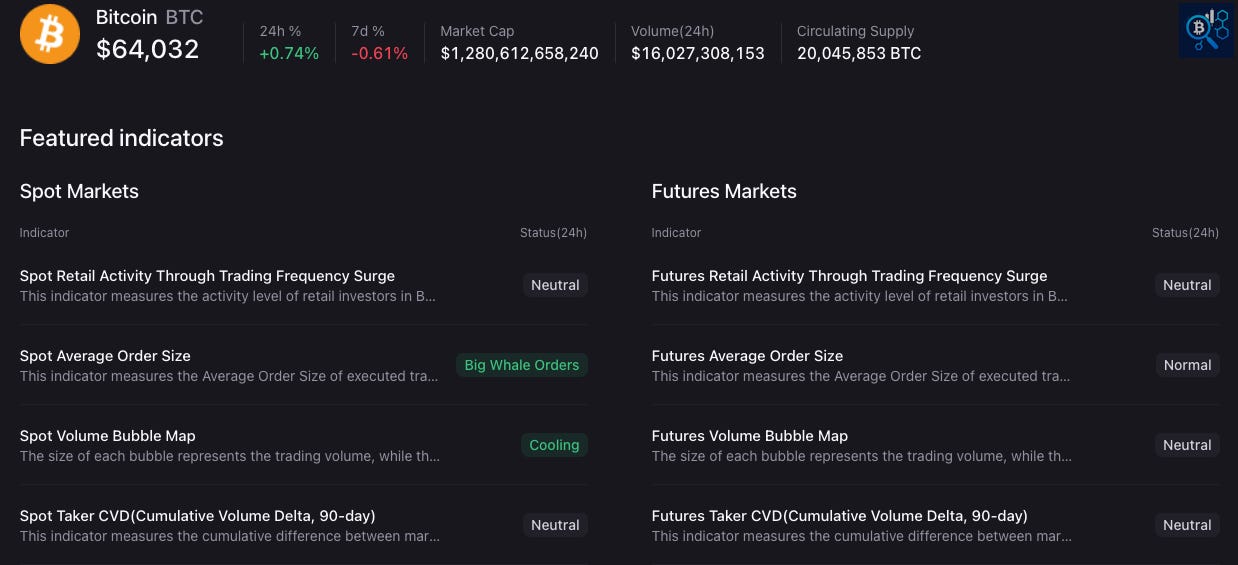
Whale-sized orders showed up on both BTC and ETH spot books this week, but only ETH's were backed by sustained buy-side flow - BTC's whale activity arrived without confirmation.
Current state - Bitcoin ($64,032 | 7D -0.61%):
Spot Retail Activity: Neutral
Spot Average Order Size: Big Whale Orders
Spot Volume Bubble Map: Cooling
Spot Taker CVD (90D): Neutral
Futures Retail Activity: Neutral
Futures Average Order Size: Normal
Futures Volume Bubble Map: Neutral
Futures Taker CVD (90D): Neutral
Current state - Ethereum ($1,731 | 7D +3.41%):
Spot Retail Activity: Neutral
Spot Average Order Size: Big Whale Orders
Spot Volume Bubble Map: Cooling
Spot Taker CVD (90D): Taker Buy Dominant
Futures Retail Activity: Neutral
Futures Average Order Size: Big Whale Orders
Futures Volume Bubble Map: Neutral
Futures Taker CVD (90D): Neutral
💬 Comment:
ETH matches the genuine absorption pattern exactly: Big Whale Orders on spot paired with a buy-dominant Taker CVD reading, which lines up with its 3.41% 7D gain against BTC’s -0.61%. BTC shows the order size without the confirmation - whale-sized spot orders are present, but Taker CVD sits neutral, and the spot volume bubble map is cooling, meaning size alone isn’t translating into directional pressure. Futures tell a similar story: ETH whales are active there too, but neutral CVD on both assets’ futures books shows no leveraged conviction behind the week’s moves either way. This week’s rebound looks structural for ETH and positional, at best, for BTC - Section 5 covers sector breadth next.
Crypto Market Sector Performance.
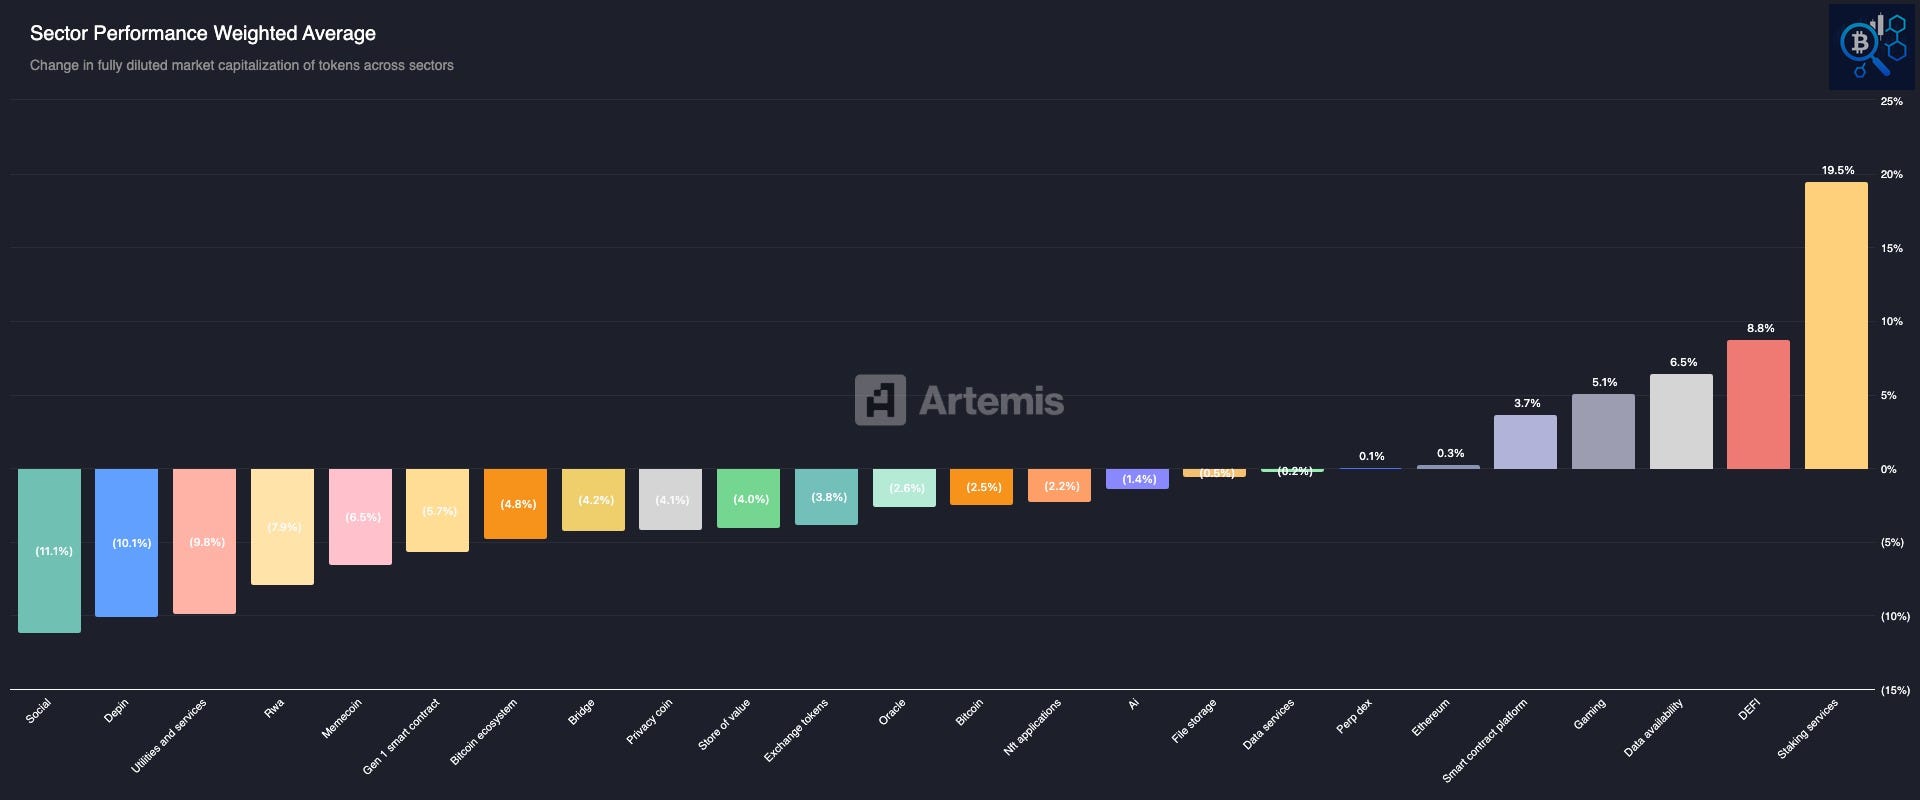
Sector Performance – Weighted Average, last 7 days
(Change in fully diluted market cap by sector, weighted by token size)
Staking Services Posted +19.5%. The Other 23 Sectors Tell a Different Story.Only 7 of 24 sectors closed green this week - a sharp reversal from last issue’s 16/24 reading - and nearly all of the positive market cap movement is concentrated in two sectors.
Current state:
Positive (7 of 24): Staking services +19.5%, DEFI +8.8%, Data availability +6.5%, Gaming +5.1%, Smart contract platform +3.7%, Ethereum +0.3%, Perp dex +0.1%
Negative (17 of 24): Social -11.1%, Depin -10.1%, Utilities and services -9.8%, RWA -7.9%, Memecoin -6.5%, Gen 1 smart contract -5.7%, Bitcoin ecosystem -4.8%, Bridge -4.2%, Privacy coin -4.1%, Store of value -4.0%, Exchange tokens -3.8%, Oracle -2.6%, Bitcoin -2.5%, NFT applications -2.2%, AI -1.4%, File storage -0.5%, Data services -0.2%
Key observation: breadth collapsed from 16 of 24 positive last issue to 7 of 24 this week - the sharpest one-week deterioration in recent issues
Three key recovery indicators:
AI: -1.4% - negative
Smart contract platform: +3.7% - positive
DeFi: +8.8% - positive
The three-sector alignment held for exactly one week before breaking - AI’s swing from +12.6% last issue to -1.4% this week ends the recovery confirmation before the second consecutive green week the framework requires.
💬 Comment:
Staking services’ +19.5% is more than double the next-best performer, and together with DeFi’s +8.8%, these two sectors account for nearly all of this week’s positive market cap movement - that is, concentration, not broad demand. The breadth collapse from 16/24 to 7/24 in a single week, paired with AI’s reversal from +12.6% to -1.4%, breaks the recovery alignment before it could carry structural weight. Bitcoin-adjacent categories aren’t escaping the contraction either - Bitcoin ecosystem (-4.8%), Store of value (-4.0%), and Bitcoin itself (-2.5%) are all negative. Section 6 covers cost basis levels next - until AI, Smart contract platform, and DeFi post simultaneous green readings again, sector breadth continues to confirm the bear regime.
🔐 Premium Insights
🧠 If you’re still reading only the free section, you’re seeing what happened.
Premium explains why it happened.
This week’s report uncovers the cost basis ceiling Bitcoin failed to reclaim, the Profit/Loss crossovers that suggest a bottom is still forming, not confirmed, the first negative year-to-date for Bitcoin ETFs since they launched, and the liquidity withdrawal showing up across Coinbase Premium and stablecoin supply alike.
Because understanding the market structure matters more than simply following the price.
🔐 Key Cost Basis Levels for Bitcoin.
Keep reading with a 7-day free trial
Subscribe to On-Chain Insights by IT Tech💡🧠 to keep reading this post and get 7 days of free access to the full post archives.