
Bitcoin and Crypto Market Report - Week 26 #183
The Bear Phase Just Reached Its Deepest Low. This Week’s Data Explains What Still Needs to Happen Before Bitcoin Finds a Bottom.

Bitcoin opened Week 26 near $63,000 and briefly fell to $58,115, marking the lowest price of this bear phase before recovering toward $60,000 by the weekend. The decline unfolded alongside another wave of ETF outflows, a sharp selloff in technology stocks, and increasingly hawkish signals from the Federal Reserve, keeping pressure on risk assets throughout the week.
The important question is no longer whether Bitcoin remains in a bear market. The data leaves little room for debate. What matters now is whether the first signs of capitulation developing across multiple on-chain metrics are enough to suggest a durable bottom is approaching, or whether the market is still only entering the bottom-building process that has historically taken months to complete.
This issue follows the path from the first signs of capitulation to the signals that have confirmed every major Bitcoin bottom over the past decade. Some of those indicators are finally beginning to move. Others remain far from the levels that marked previous cycle lows. Together, they provide one of the clearest roadmaps yet for understanding what still needs to happen before this bear market can truly end. Welcome to the 183rd issue of On-chain Insights by IT Tech.
This Week in On-Chain:
Bitcoin printed a new bear market low at $58,115, falling 52.9% below the all-time high and extending the lower-low sequence that began earlier this month.
Bitcoin ETF outflows accelerated again to -$1.79B, bringing the seven-week redemption streak to -$7.72B and erasing hopes that institutional selling was beginning to slow.
The Coinbase Premium Gap remained negative for both Bitcoin and Ethereum throughout the entire week, extending the absence of U.S. spot demand to 336 consecutive hours.
The Realized Profit/Loss Ratio Bottom Alert has now triggered on 13 days this year. Previous bear market bottoms required more than three times as many alert days before a durable low was confirmed.
The gap between Short-Term Holder and Long-Term Holder Realized Price remains around $20,900. Every major Bitcoin bottom since 2011 formed only after those two lines converged.
Whale positioning began improving one day before Bitcoin reached its weekly low, suggesting that larger participants reduced short exposure into the final leg of the decline rather than increasing it.
🔗 Stay Connected:
🎥 YouTube: Onchain_Insights - English | IT Tech PL - Polish | Hub: btc-analysis.com
New Telegram Community for Active Traders.
I share structured trade ideas for Bitcoin and Ethereum aligned with the on-chain framework used in this report. Access is free via one of the partner exchanges. Both exchanges are regulated in the European Union.
Bybit.eu 🇪🇺 EU users (EEA) - claim up to 40 USD 🎁 in BTC
OKX.com - MiCA and MiFID II licenses - Spot and derivatives trading in the EU 🇪🇺
👉 Full instructions and access:
*Disclaimer: Educational content only. Not investment advice. Past performance does not guarantee future results.
Top 10 Market News: Crypto, Stocks & Macro (June 22-28, 2026).
Hawkish Fed signals, a tech-driven equity selloff, and a sixth consecutive week of Bitcoin ETF outflows defined the week - geopolitical de-escalation provided brief relief but did not change the structural backdrop.
Bitcoin Holds the $58K-$64K Range Under Continued Selling Pressure. BTC oscillated between $58K and $64K, briefly testing multi-week lows near $58K-$61K on risk-off moves before recovering. ETF outflows extended to a sixth consecutive week, adding approximately $227M in redemptions and bringing the six-week total to over $5.9B. Long-term holders accumulated at the low, but institutional demand contracted further.
Nasdaq Selloff Drags Crypto Lower. The Nasdaq fell 1.3%-2.2% on key sessions June 22-23, driven by AI talent departures at Alphabet, escalating data center costs, and semiconductor weakness. Bitcoin continued to trade in correlation with high-beta tech, with BTC declining in lockstep on the heaviest drawdown days.
US-Iran Ceasefire Progress Reduces Geopolitical Risk Premium. A memorandum of understanding reduced immediate escalation fears, pushing Brent crude below $74 for the first time in months. Risk sentiment improved intraweek, but accusations of ceasefire violations kept the relief fragile and short-lived.
Fed Holds Rates at 3.50%-3.75%; New Chair Warsh Signals Hawkish Stance. Under incoming Chair Kevin Warsh, the FOMC held rates unchanged while revising inflation projections upward. Fed Governor Kashkari flagged the possibility of rate hikes if inflation fails to decline. PCE data released during the week reinforced the cautious posture, removing any near-term rate-cut catalyst.
Equity Markets Split: Dow Resilient, Nasdaq and S&P Under Pressure. The S&P 500 traded in the 7,300-7,400 range as tech-driven weakness dominated, while the Dow held steadier and small-cap names showed relative strength. Sector rotation away from AI-heavy large caps was visible but not yet sustained.
Inflation Prints Remain Elevated; Earlier Energy Spike Still Flowing Through. CPI and PPI readings came in hotter than expected, partially due to lagged energy effects from prior weeks. The Iran ceasefire introduced downward pressure on oil for future prints, but core inflation remained elevated enough to keep the Fed in wait-and-see mode.
AI Spending Debate Pressures Big Tech. Strong aggregate Q1 earnings provided a floor for equity sentiment, but concerns over the sustainability of AI infrastructure spending - combined with Micron guidance uncertainty and talent-departure headlines at Alphabet - kept large-cap tech under pressure through the week.
Nearly 11 Million Bitcoin Now Held at a Loss - a New Record for This Bear Phase. On-chain data confirmed approximately 11M BTC in loss, a new cycle high for unrealized losses. Some LTH distribution into the $63K-$64K recovery was observed, consistent with the pattern documented in Issue #181, where the 30-day moving average of LTH exchange inflows reached 6.77%.
US Macro Fundamentals Remain Resilient Despite Asset Market Pressure. GDP revisions, consumer spending, and labor data all pointed to underlying economic strength. Prediction market odds for a US recession in 2026 fell to approximately 10% - the lowest reading of the year. International economies adjusted forecasts upward on lower energy input costs.
Regulatory Landscape: UK Stablecoin Flexibility, US Uncertainty Persists. The UK's advanced flexible stablecoin regulation is a positive structural development for the ecosystem. In the US, CFTC scrutiny of Polymarket and the absence of comprehensive crypto legislation continued to create regulatory overhang. The potential OpenAI IPO delay added uncertainty to the broader digital-asset narrative.
💬 Comment:
The week presented a clear macro configuration: hawkish Fed leadership, sticky inflation, and a tech selloff all pulling in the same risk-off direction, while the Iran ceasefire acted as a counterweight that temporarily reduced energy prices and lifted sentiment without changing the underlying rate environment. Kevin Warsh’s debut as Chair with upward inflation revisions and a Kashkari rate-hike signal removed any remaining market expectation of a cut before Q4. The geopolitical relief is real but conditional - a ceasefire accusation late in the week demonstrated how quickly that risk premium can return. Macro context this week was uniformly bearish for rate-sensitive assets, but macro alone does not determine the on-chain regime - it shapes the volatility envelope within which capital flows, and holder behavior operate. Section 3 examines where the price structure landed after absorbing all of the above.
General Market Update.
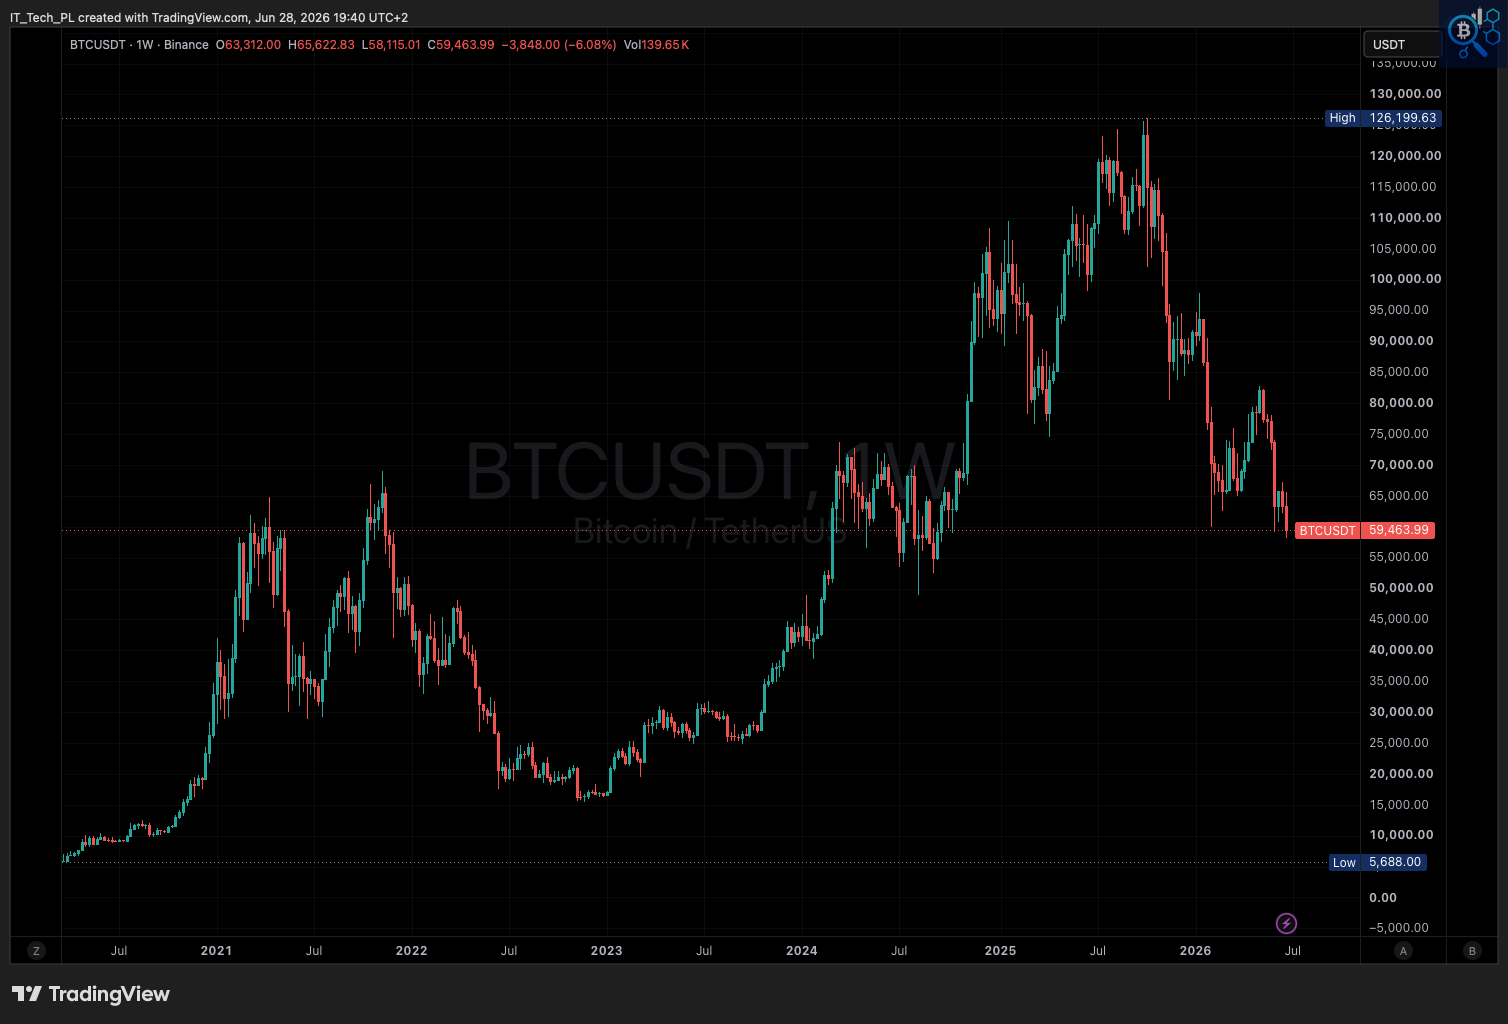
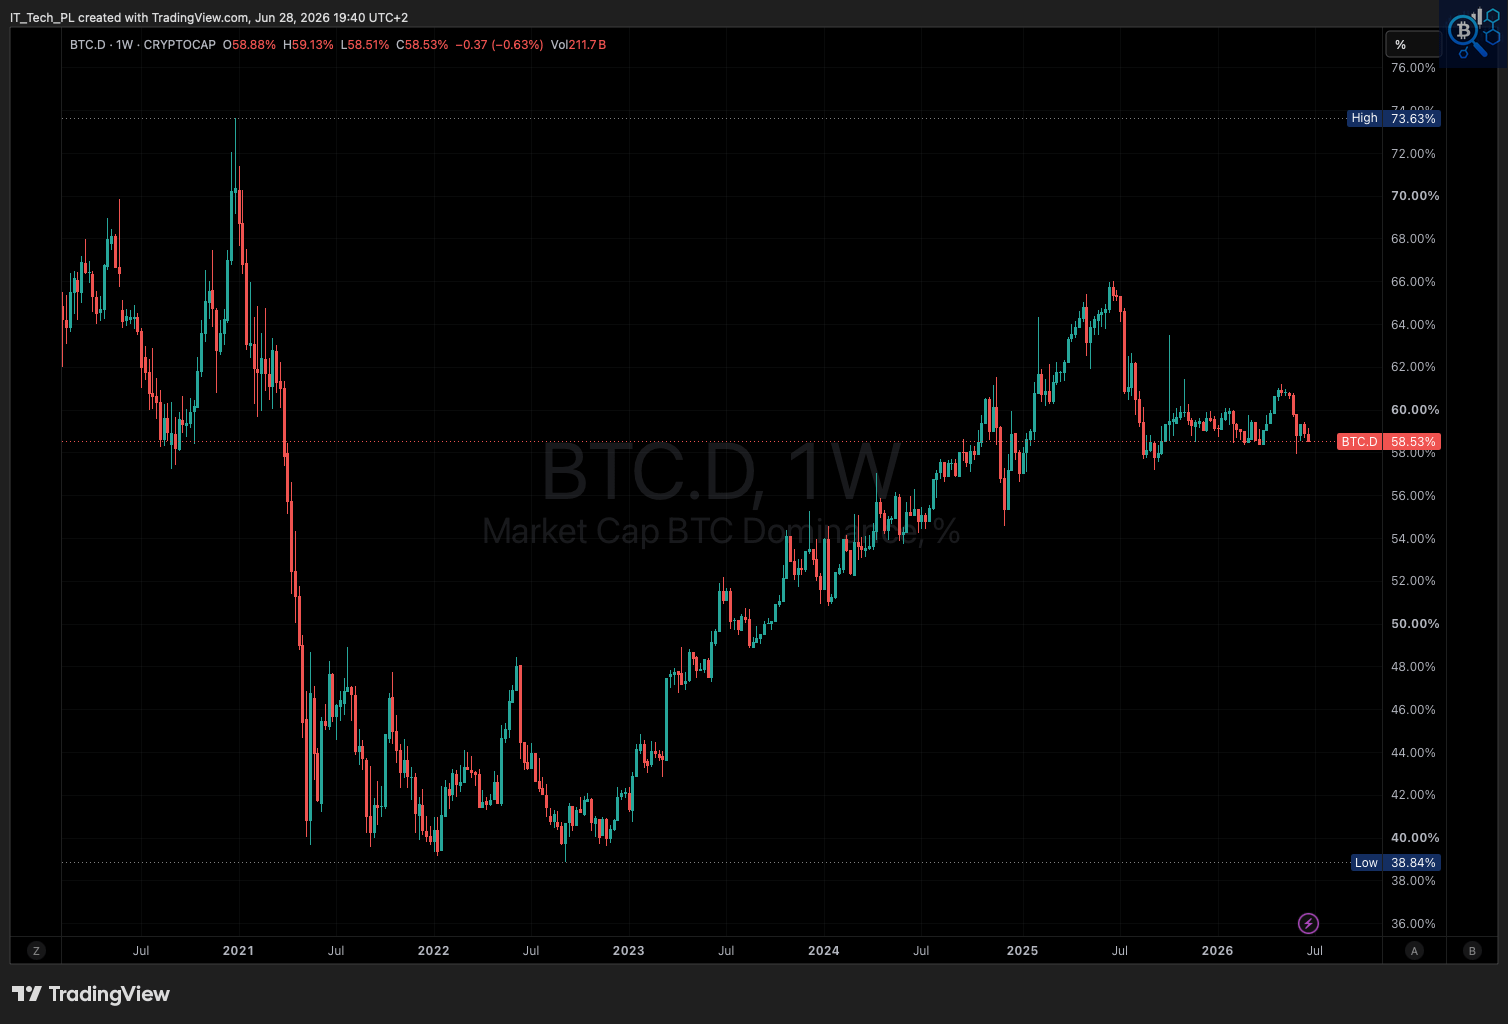
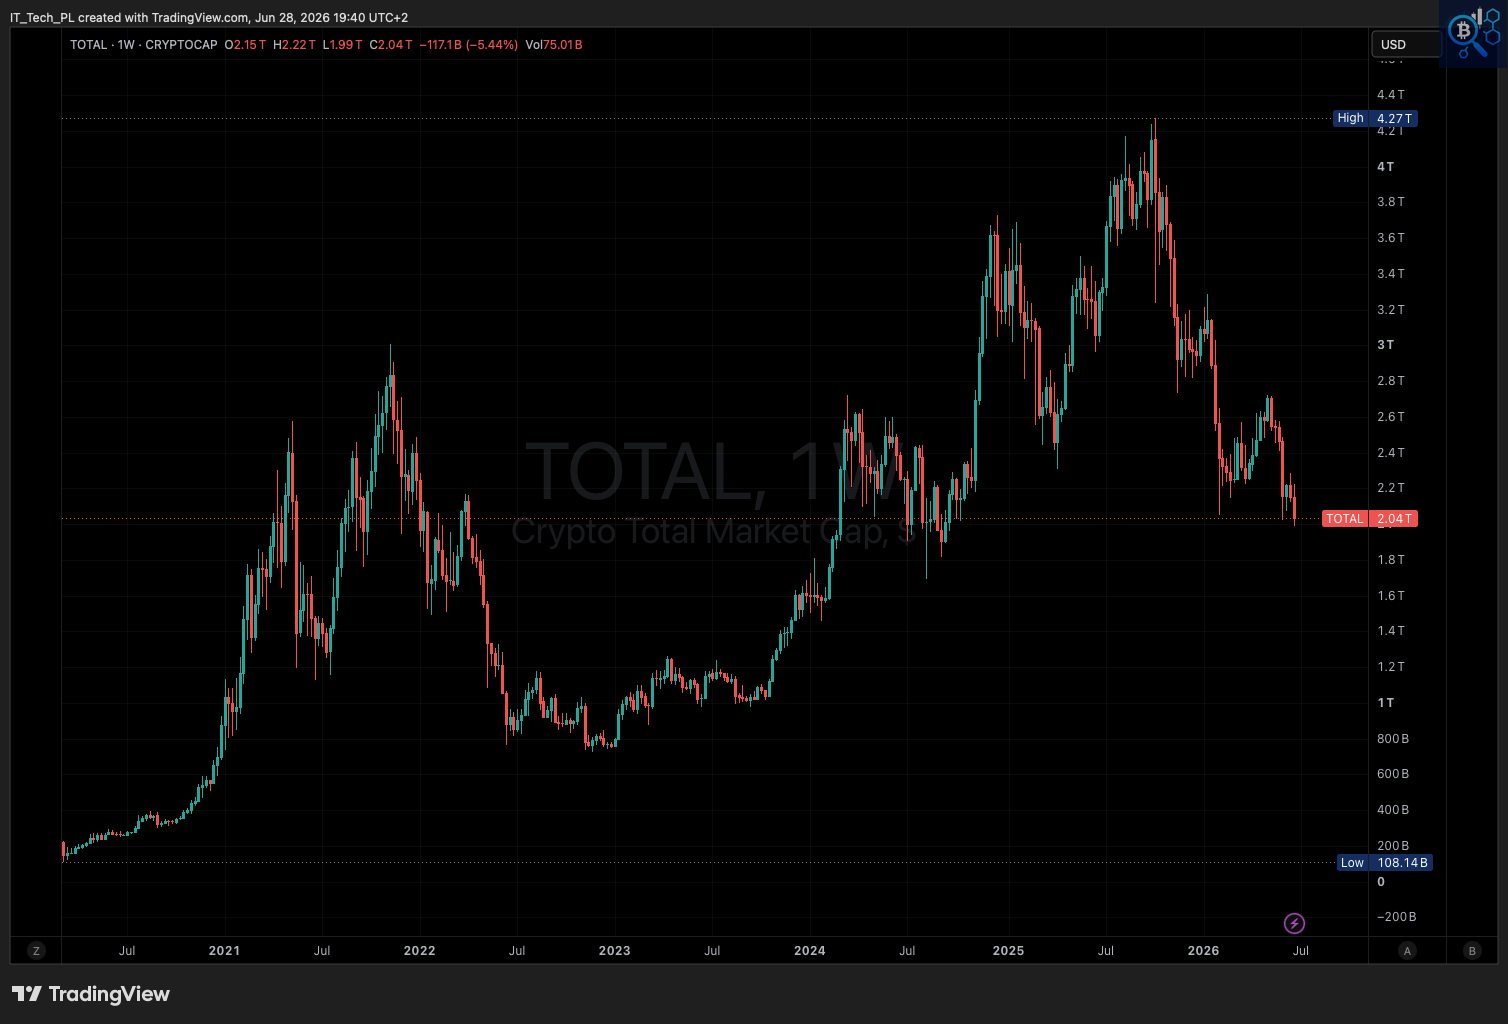
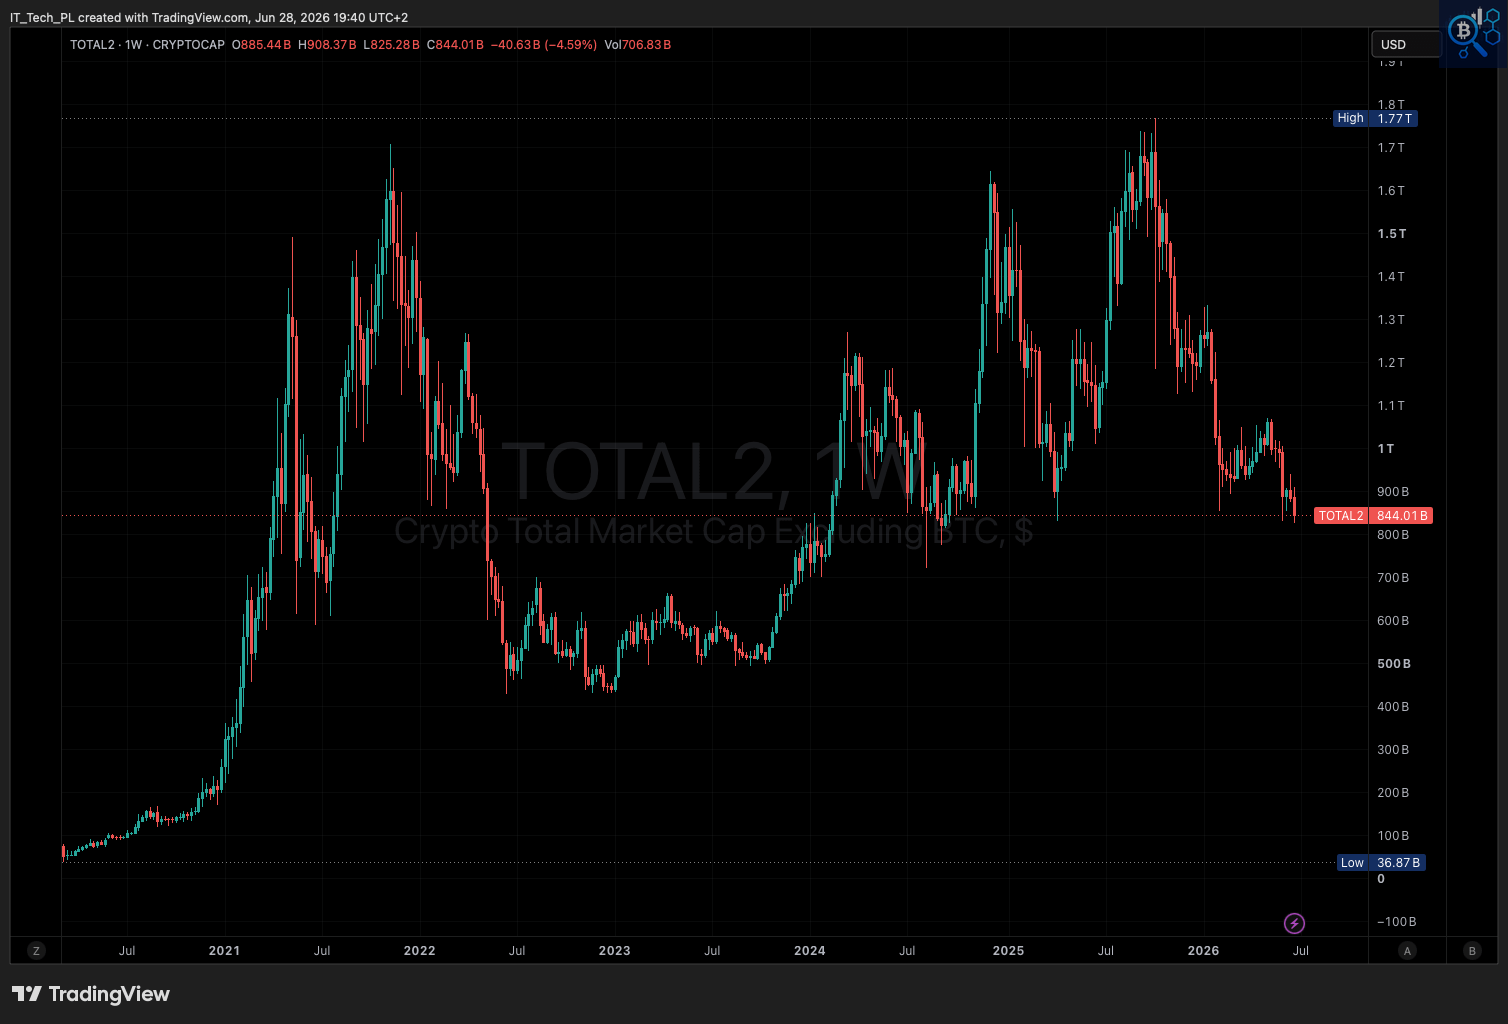
Bitcoin broke below $60K intraweek for the first time in this bear phase, and the total crypto market cap pierced $2T on the weekly low - two structural thresholds breached on the same candle.
Current state:
BTC (1W, candle still open - Sunday): O $63,312 | H $65,622 | L $58,115 | C $59,463 | WoW -6.08% vs prior close $64,563 | ATH $126,199 (-52.9%) - second consecutive red weekly candle, low of $58,115 marks the deepest intraweek print of the bear phase
BTC.D (1W, candle still open): C 58.53% | H 59.13% | L 58.51% | WoW -0.37% | Cycle high 73.63% - dominance slipped below 59% for the first time since early 2026; no meaningful altcoin rotation, decline reflects correlated selling
TOTAL (1W, candle still open): C $2.04T | H $2.22T | L $1.99T | WoW -5.44% | ATH $4.27T (-52.2%) - intraweek low of $1.99T marks the first breach of the $2T level in this bear phase; the candle body is recovering above $2T but the wick confirms the threshold was tested
TOTAL2 ex-BTC (1W, candle still open): C $844B | H $908B | L $825B | WoW -4.59% | ATH $1.77T (-52.3%) - declining at a slower pace than Bitcoin this week, but the $825B intraweek low represents significant structural deterioration with no recovery catalyst visible
Key levels:
BTC resistance: $63,312 (weekly open, now overhead) | $65,622 (weekly high, rejected) | $70,000 (psychological zone)
BTC support: $58,115 (weekly intraweek low - first line of defense) | $55,000-$56,000 (next major structural zone) | $50,000 (psychological floor)
TOTAL resistance: $2.15T (weekly open) | $2.22T (weekly high) | Support: $1.99T (intraweek low) | $1.80T-$1.85T (next zone)
TOTAL2 resistance: $885B (weekly open) | Support: $825B (weekly low) | $750B-$770B (next structural zone)
BTC.D: 59.13% resistance (weekly high) | 58.51% support (weekly low) | Key rotation threshold: 57%-58% on a sustained close
💬 Comment:
Bitcoin’s intraweek low at $58,115 is the deepest print of this bear phase - deeper than the Week 23 capitulation low of $59,018 cited in Issue #180 - confirming that price continues to make lower lows without any structural floor forming. The $2T breach on TOTAL, even intraweek, carries structural weight: this level held as support throughout the first half of 2024, and its loss as a floor marks a meaningful deterioration in the total ecosystem valuation. BTC.D declining slightly to 58.53% reflects correlated selling rather than altcoin rotation - when every asset falls together, and Bitcoin still leads the decline, dominance compression is noise, not a rotation indicator. TOTAL2’s slower percentage decline (-4.59% vs BTC’s -6.08%) is also consistent with a mechanical rebalancing dynamic, not genuine altcoin strength. At the time of writing (Sunday), all candles remain open, and the weekly close in the next hour will determine whether BTC posts a confirmed weekly close below $60K - a level that, if sustained, would mark the lowest weekly close of this bear phase. The regime label remains Bear.
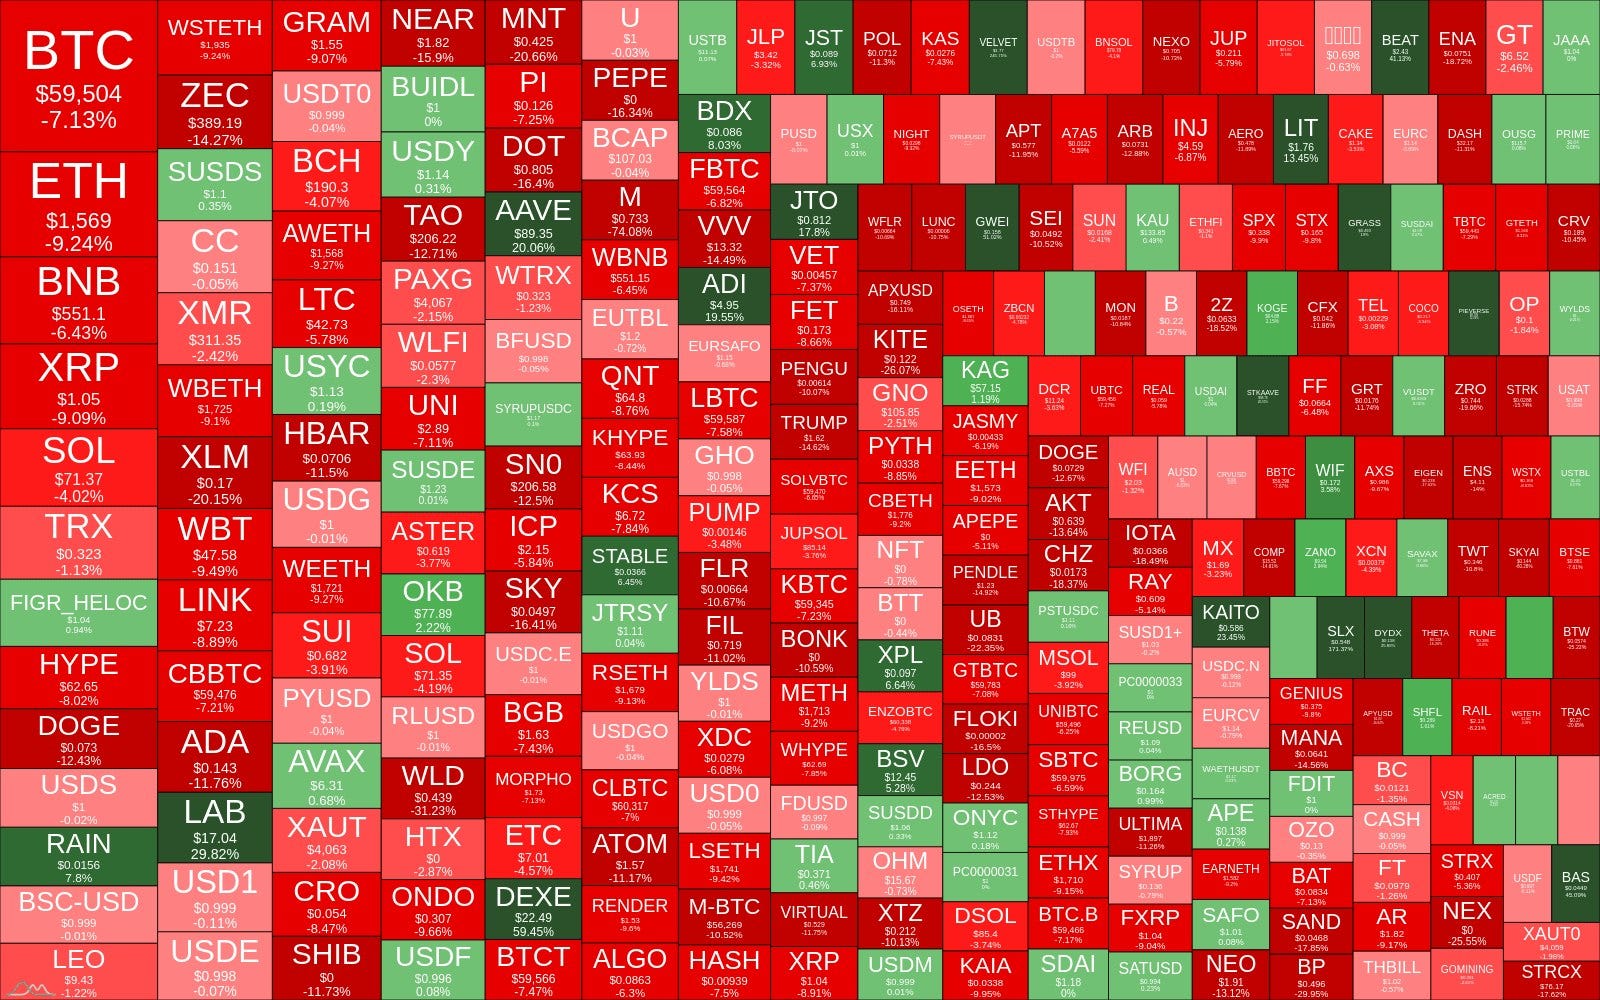
Crypto Heatmap TOP 300 Coins (7D).
The heatmap is almost entirely red, with breadth at its weakest reading in weeks - an isolated RWA token and tokenized gold are the only meaningful green clusters in a sea of broad losses.
Current state:
BTC: -7.13% ($59,504) | ETH: -9.24% ($1,569) - Ethereum underperforming Bitcoin by 2.11 percentage points, the opposite of what rotation would require
Majors: BNB -6.43%, SOL -4.02%, XRP -9.09%, TRX -1.13% - SOL and TRX showing relative resilience while XRP aligns with the broader selloff
Severe underperformers: XLM -20.15%, DOGE -12.43%, ADA -11.76%, HBAR -11.5%, NEAR -15.9% - legacy large-caps absorbing the most damage
Notable green: ONDO +59.45% (RWA - specific catalyst), XAUT +29.82% (tokenized gold, flight to safety), KAITO +23.45%, SUSD1+ +23.45%, AAVE +20.06%, JTO +17.8% - no sector clustering; individual project events only
Infrastructure: broadly red with no confirmed sector rotation signal
💬 Comment:
Breadth at this level - roughly 15-20 green assets out of hundreds - is not a correction pattern; it is a liquidation pattern, where correlated selling removes the distinction between quality and noise. Ethereum underperforming Bitcoin is the clearest confirmation that capital is not rotating within crypto but exiting it: in genuine recovery phases, Ethereum leads or matches Bitcoin, not lags it by over two percentage points. The two most notable green positions - a tokenized gold product and an RWA-specific token - tell a defensive story rather than a risk-on one, as capital migrated toward real-world asset backing rather than speculative exposure. ONDO’s +59.45% is a single-asset event driven by project-specific news, not a sector catalyst - it does not elevate the broader breadth reading. Section 4 examines the order flow and market structure behind this week’s price action next. Until sector breadth turns broadly positive across at least 60% of assets in consecutive weeks, the market remains in broad distribution, not recovery.
I built a free on-chain dashboard on CryptoQuant. Bitcoin macro metrics, NUPL, SOPR, STH cost basis, exchange flows, and much more - all in one place. No noise. Just the data I actually track.
Whale Orders Appeared on Both Spot Markets. Only Ethereum's CVD Moved.
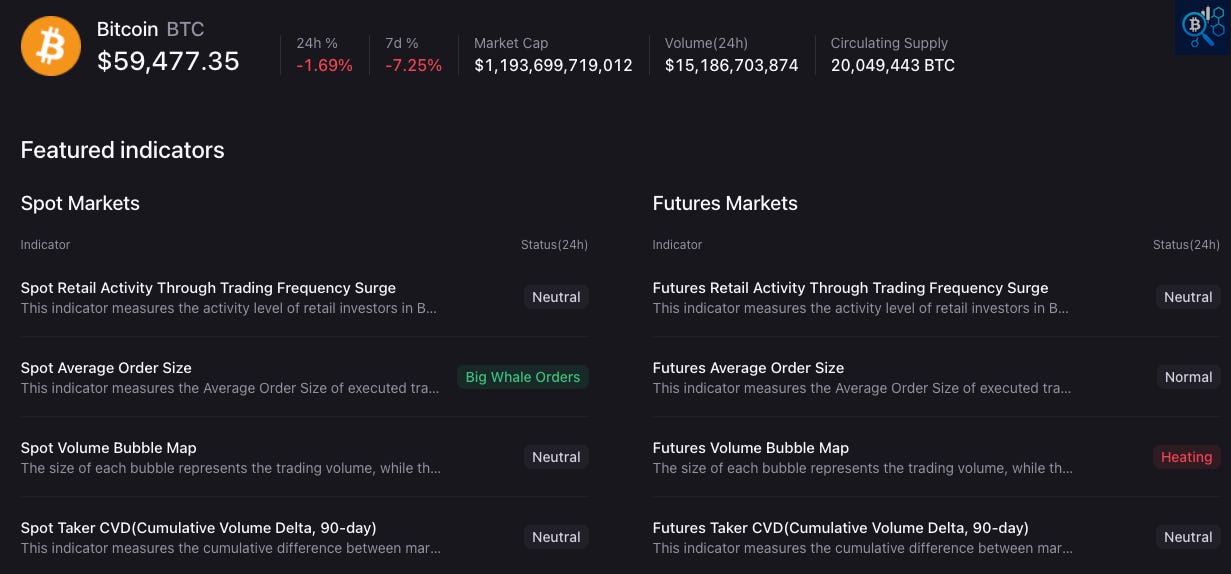
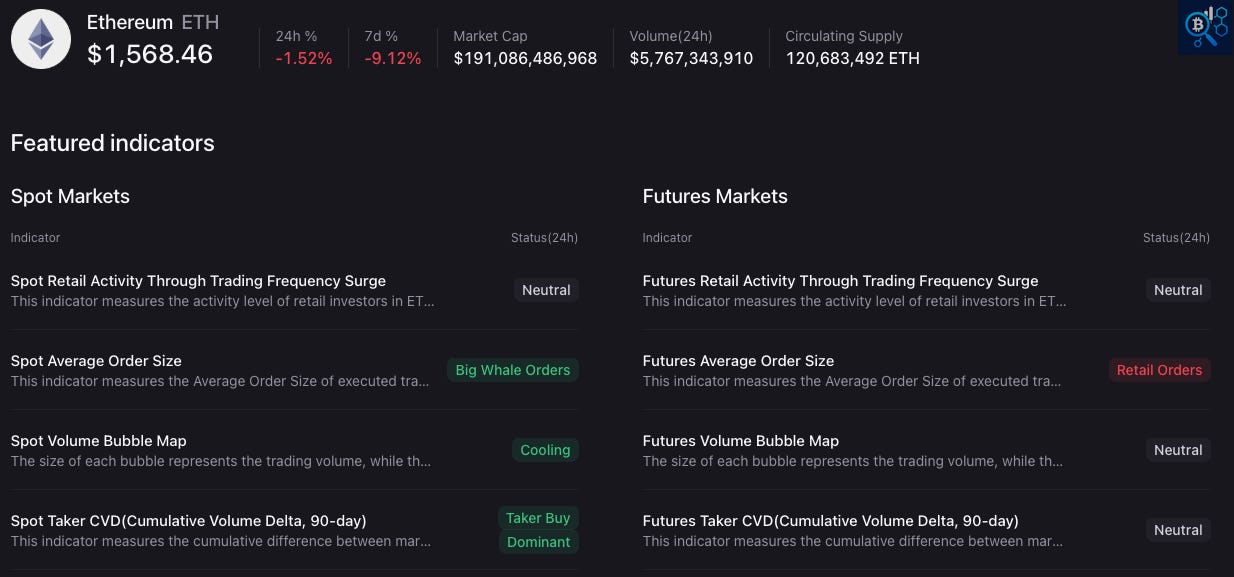
Large-size spot transactions emerged on both Bitcoin and Ethereum this week - but the directional picture they paint is entirely different for each asset.
Current state - Bitcoin ($59,477 | 7D -7.25%):
Spot Retail Activity: Neutral - no retail surge accompanying the selloff
Spot Average Order Size: Big Whale Orders - large-size spot transactions active at the $58K-$65K range
Spot Volume Bubble Map: Neutral - volume not expanding; no panic or absorption spike
Spot Taker CVD (90D): Neutral - buy and sell pressure balanced despite whale order presence
Futures Retail Activity: Neutral - retail futures participation not elevated
Futures Average Order Size: Normal - no unusual positioning from larger futures participants
Futures Volume Bubble Map: Heating - futures activity increasing while the candle is still open
Futures Taker CVD (90D): Neutral - no directional bias from futures takers
Current state - Ethereum ($1,568 | 7D -9.12%):
Spot Retail Activity: Neutral - retail absent on spot
Spot Average Order Size: Big Whale Orders - whale-size spot orders matching the Bitcoin reading
Spot Volume Bubble Map: Cooling - spot volume diminishing, urgency fading
Spot Taker CVD (90D): Taker Buy Dominant - net buy pressure on spot over the 90-day window
Futures Retail Activity: Neutral - retail not driving Ethereum futures
Futures Average Order Size: Retail Orders - futures market dominated by smaller participants
Futures Volume Bubble Map: Neutral - futures activity not elevated
Futures Taker CVD (90D): Neutral - no futures directional confirmation
💬 Comment:
Bitcoin's whale-size spot orders executing into the $58K-$65K range while the 90-day CVD remains neutral indicates two-sided institutional activity, not structural accumulation - large participants are transacting in volume without producing a net directional imbalance. The Futures Volume Heating reading adds positioning noise rather than conviction: futures activity increasing with a still-open candle and neutral CVD reflects participants taking both sides of the range, not committing directionally. Ethereum presents the more constructive configuration - Big Whale Orders on spot paired with Taker Buy Dominant CVD suggests net absorption at current levels - but this is undermined by Retail Orders dominating futures with no CVD follow-through, confirming the spot demand is not being reinforced by a broader participant base. Neither asset has the structural order flow behind it to support a sustained recovery. Section 5 examines how the week's damage is distributed across crypto sectors next. Until Bitcoin's spot CVD turns net positive and Ethereum's futures order size upgrades from Retail to Normal or above, the structure behind this week's price action remains inconclusive.
Crypto Market Sector Performance.
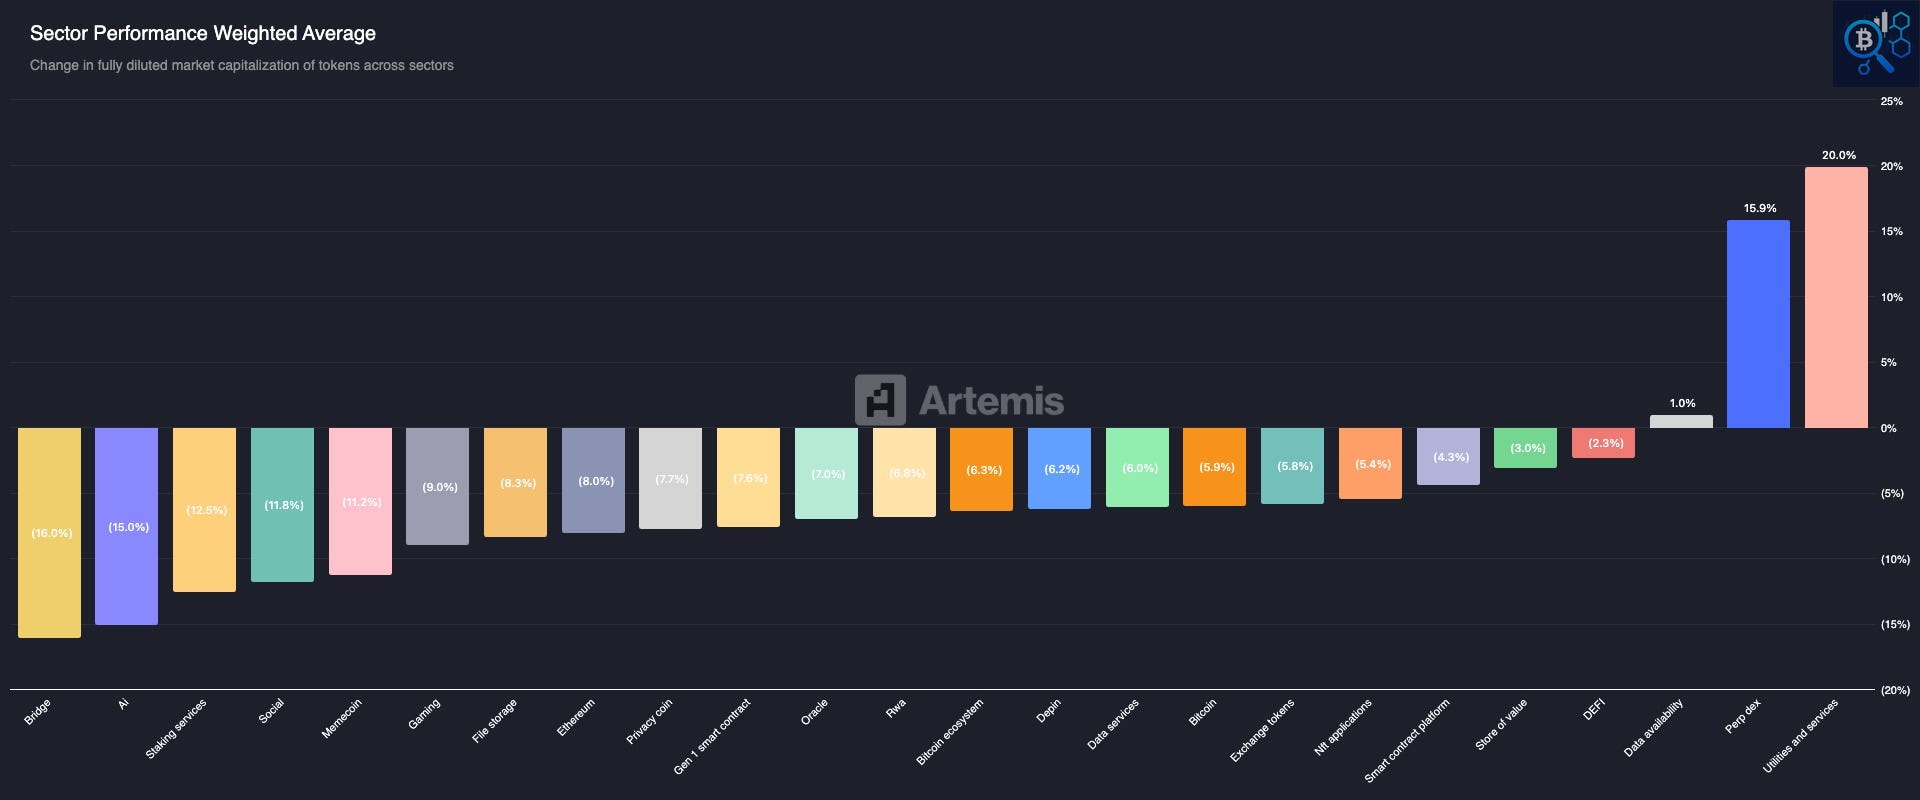
Sector Performance – Weighted Average, last 7 days
(Change in fully diluted market cap by sector, weighted by token size)
Staking Services Posted +19.5%. The Other 23 Sectors Tell a Different Story.Only 7 of 24 sectors closed green this week - a sharp reversal from last issue’s 16/24 reading - and nearly all of the positive market cap movement is concentrated in two sectors.
Current state:
Positive (7 of 24): Staking services +19.5%, DEFI +8.8%, Data availability +6.5%, Gaming +5.1%, Smart contract platform +3.7%, Ethereum +0.3%, Perp dex +0.1%
Negative (17 of 24): Social -11.1%, Depin -10.1%, Utilities and services -9.8%, RWA -7.9%, Memecoin -6.5%, Gen 1 smart contract -5.7%, Bitcoin ecosystem -4.8%, Bridge -4.2%, Privacy coin -4.1%, Store of value -4.0%, Exchange tokens -3.8%, Oracle -2.6%, Bitcoin -2.5%, NFT applications -2.2%, AI -1.4%, File storage -0.5%, Data services -0.2%
Key observation: breadth collapsed from 16 of 24 positive last issue to 7 of 24 this week - the sharpest one-week deterioration in recent issues
Three key recovery indicators:
AI: -1.4% - negative
Smart contract platform: +3.7% - positive
DeFi: +8.8% - positive
The three-sector alignment held for exactly one week before breaking - AI’s swing from +12.6% last issue to -1.4% this week ends the recovery confirmation before the second consecutive green week the framework requires.
💬 Comment:
Staking services’ +19.5% is more than double the next-best performer, and together with DeFi’s +8.8%, these two sectors account for nearly all of this week’s positive market cap movement - that is, concentration, not broad demand. The breadth collapse from 16/24 to 7/24 in a single week, paired with AI’s reversal from +12.6% to -1.4%, breaks the recovery alignment before it could carry structural weight. Bitcoin-adjacent categories aren’t escaping the contraction either - Bitcoin ecosystem (-4.8%), Store of value (-4.0%), and Bitcoin itself (-2.5%) are all negative. Section 6 covers cost basis levels next - until AI, Smart contract platform, and DeFi post simultaneous green readings again, sector breadth continues to confirm the bear regime.
🔐 Premium Insights
🧠 If you’re reading only the free section, you’ve seen what happened this week.
Premium explains why it happened, what still hasn’t happened, and which on-chain signals have historically confirmed every major Bitcoin bottom.
This week’s report uncovers the cost basis ceiling Bitcoin failed to reclaim, why realized losses are only entering the early stage of capitulation, how whale positioning diverged before the weekly low, why ETF outflows and Coinbase Premium still point to weak demand, and how far the market remains from the historical conditions that marked previous cycle bottoms.
Because understanding where the market is matters. Knowing what still needs to happen matters even more.
🔐 Key Cost Basis Levels for Bitcoin.
Keep reading with a 7-day free trial
Subscribe to On-Chain Insights by IT Tech💡🧠 to keep reading this post and get 7 days of free access to the full post archives.