


#114 On-chain Insights by IT Tech - Week 5 Bitcoin Analysis & Highlights
Bitcoin’s Next Move: Institutional Demand vs. Weak Network Activity

Hello,
The 114th issue of On-chain Insights by IT Tech is out! I appreciate your support - over 4,500 subscribers strong! Haven’t joined yet? Now's the time to join! 👇
Table of contents:
Partnership with WymienBitcoina.pl
Current market situation
Coinbase Premium Index & ETF Analysis
Bitcoin Network Slows: Temporary Dip or Structural Shift?
Bitcoin Profit Margins Turn Negative: A Warning or Just a Dip?
Bitcoin at Key Levels: Key Support and Resistance to Watch
Correlation between USDT and USDC market caps and Bitcoin price
Support the Newsletter: Exclusive Content & Perks
Newsletter issue summary
Forecast for the Upcoming Week
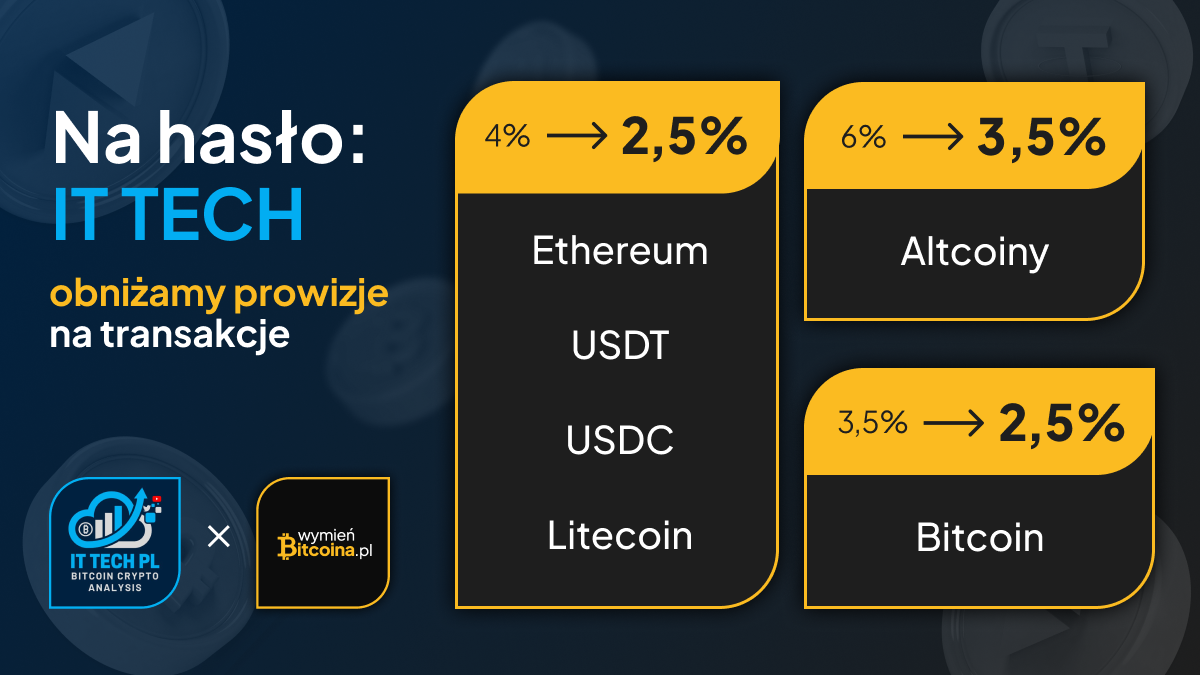
1. Partnership with WymienBitcoina.pl
I'm thrilled to collaborate with WymienBitcoina.pl, founded by Patryk Kempiński of Krypto Raport.
WymienBitcoina.pl offers a secure way to trade over 190 cryptocurrencies and access crypto-related products like wallets and books, supported by expert staff.
To make it even better, I’ve waived my commission for lower fees - use the code IT TECH for additional savings!
Follow me on X/Twitter 👉 click and subscribe to my YouTube channel 👉 click.
Find all my social media and important links in my pinned post on X/Twitter, including my Linktree. Join the discussion group linked on my profile (requests must be approved). Stay updated with alerts, liquidation levels, and more.

Get faster updates and more content on my free Telegram channels:
IT Tech Crypto - Analysis, Liquidations maps, alerts, and more.
IT Tech Crypto - comments - commentary channel for everyone, On-chain alerts, bots, reports, and more.
Unfortunately, X/Twitter has blocked the embedding of tweets on Substack, so I include screenshots of the tweets along with links to them in the description.Weekly On-Chain Dashboard - New Indicators.

Here you'll find all the essential charts for market analysis in one place. It's free for everyone. Enjoy it! 👇
2. Current market situation.

🔴 Market Overview – Heavy Sell-off Across Crypto 🔴
The crypto market is experiencing a significant sell-off, with most assets deep in the red. Here’s a breakdown of the key takeaways:
📉 Major Cryptos Declining
Bitcoin (BTC): $96,916 (-2.74%) – BTC remains under pressure, failing to sustain previous highs.
Ethereum (ETH): $2,667 (-14.17%) – ETH leads the downturn with a double-digit drop, indicating broad market weakness.
XRP: $2.47 (-14.74%) – Heavy losses align with the overall market trend.
Solana (SOL): $202.31 (-14.74%) – SOL mirrors ETH’s drop, signaling risk-off sentiment.
Binance Coin (BNB): $639.27 (-2.54%) – Holds up slightly better than most, but still down.
🟥 Altcoins Suffer Heavy Losses
Most altcoins are in deep red, with double-digit losses in many sectors.
Meme coins like SHIB and PEPE have taken significant hits (-7.13% and -17.34%, respectively).
Layer 1 and DeFi tokens (TON, NEAR, ALGO, APT) also show notable declines, reflecting broader market weakness.
✅ Few Bright Spots in the Market
Stablecoins like USDT, USDC, and USDX remain flat, highlighting a flight to safety.
Selective alts in green:
LTC: $106.6 (+8.65%) – Showing resilience in a weak market.
HYPE, KAVA, DEXE, GMX – Minor gains suggest some capital rotation.
🔎 Key Market Insights
Risk-off Sentiment – The red-heavy market suggests investors are taking profits or de-risking positions.
ETH & SOL Leading Declines – Major altcoins underperform, hinting at potential liquidations.
Bitcoin Dominance Check – BTC’s relatively lower decline suggests capital consolidates in the largest asset.
📊 What’s Next?
🔹 Watch for BTC support around $96K – a break below could accelerate losses.
🔹 Monitor ETH’s next levels, especially if it stays below $2,700.
🔹 Keep an eye on stablecoin flows – increased inflows could indicate preparation for buying opportunities.
👉 What are your thoughts on this market pullback? Are you buying the dip or staying cautious?
3. Coinbase Premium Index & ETF Analysis.

The Coinbase Premium Index measures the price difference between Coinbase Pro (USD pair) and Binance (USDT pair). High premium values may indicate strong buying pressure from U.S. investors on Coinbase.Coinbase Premium Index Analysis – Institutional Sentiment Shift.
📊 Key Observations:
Institutional Buying Resumes – The Coinbase Premium Index has turned positive after sustained negative values, indicating renewed U.S. institutional demand.
Price Reaction – Bitcoin rebounded from $94K to $97K, aligning with the positive shift in the premium.
Sustained Positive Premium Since Feb 3 – Unlike previous short-lived spikes, institutional buying appears more consistent.
Correlation with Price Bottoming – Historically, a positive premium aligns with local price bottoms and potential trend reversals.
Still Below Key Resistance – Bitcoin must reclaim $100K+ to confirm sustained upside momentum.
📉 Market Implications:
A sustained positive premium suggests institutional demand could support Bitcoin at current levels.
However, failure to maintain the premium may indicate another wave of selling pressure.
A return to negative values would be bearish, signaling further downside risk.
📌 Conclusion:
The return of institutional demand is a bullish sign, but Bitcoin needs to reclaim key levels to confirm a trend reversal. Traders should watch the Coinbase Premium Index closely for signs of continued institutional accumulation or fading interest.

ETF Bitcoin Holdings – Key Observations & Market Implications
📊 ETF Net Flows Summary (Last 7 Days):
Total Holdings: 1,181,123 BTC across all listed ETFs.
Daily Changes:
Feb 8: +1,620 BTC inflows.
Feb 7: -1,422 BTC outflows.
Feb 6: +395 BTC inflows.
Feb 5: +3,441 BTC inflows.
Feb 4: -2,106 BTC outflows.
📉 Market Implications:
BlackRock & Fidelity Lead Institutional Accumulation: These two funds are maintaining positive net inflows, showing sustained institutional demand.
Grayscale Outflows Still a Concern: Continued sell pressure from GBTC may limit Bitcoin’s ability to sustain a breakout.
Net Inflows Outpacing Outflows: Despite some ETF redemptions, overall Bitcoin ETF demand has remained positive over the past week.
📌 Conclusion:
ETF flows remain a critical driver of Bitcoin price action. While Grayscale outflows persist, institutional demand from BlackRock, Fidelity, and Ark suggests long-term bullish support. Traders should monitor net ETF inflows closely for insights into broader market direction.
4. Bitcoin Network Slows: Temporary Dip or Structural Shift?

Bitcoin Network Activity Analysis
🚨 Bitcoin Network Activity Hits 1-Year Low – Transactions down 53%, mempool nearly empty, and fees at depressed levels.
📉 RUNES Protocol Collapse – Speculative token minting activity vanished, causing a sharp decline in transactions.
⚠️ Bitcoin Mempool Plummets – Pending transactions fell from 287K (Dec 2024) to just 3K, signaling weak network demand.
💰 Transaction Fees at Record Lows – Daily fees dropped to $593K, making up only 1.8% of miner revenue, impacting miner profitability.
🔍 Bitcoin Overvalued vs. Network Activity – Metcalfe Valuation Bands suggest BTC’s fair value is $48K-$95K, raising concerns at the current $99K price level.
📊 Market Outlook:
Bearish if network demand doesn’t recover—potential downside risk.
Bullish if institutional demand (ETFs) offsets weak on-chain usage.
🔎 What to Watch?
Mempool congestion & transaction growth for signs of renewed demand.
Miner revenue trends – Weak fees could lead to capitulation.
Stablecoin flows & ETF inflows as alternative indicators of liquidity.
5. Bitcoin Profit Margins Turn Negative: A Warning or Just a Dip?

A key observation from the Bitcoin On-Chain Trader Realized Price and Profit/Loss Margin chart is that the profit/loss margin briefly dipped below 0%, marking a significant shift in market dynamics. This suggests that short-term holders (Bitcoin held between 1 month and 3 months), who were previously in profit, have now entered net loss territory, indicating increasing sell-side pressure. Historically, such events often coincide with local bottoms or trend reversals, as weaker hands exit the market while stronger hands accumulate.
This development raises two key scenarios: If the margin remains negative, it could fuel further downside momentum, with BTC potentially testing $90K support. However, if this dip was a temporary flush, and the margin quickly recovers above zero, it could signal a potential bounce as selling exhaustion sets in. The coming days will be crucial in determining whether this is a structural trend shift or just a short-term shakeout before continuing higher.
6. Bitcoin at Key Levels: Key Support and Resistance to Watch.

The Bitcoin price action remains in a consolidation phase, currently trading at $97K. The price is hovering just below the Short-Term Holder (STH) 1W-1M Realized Price ($101.57K), which has acted as resistance. Meanwhile, the 1M-3M STH Realized Price ($97.39K) is being tested, suggesting that short-term holders are near their breakeven point. The broader STH Realized Price ($90.66K) serves as the next key support level. A drop below this zone could trigger further selling, while a reclaim of $101K+ would confirm renewed bullish momentum.
The long-term trend remains intact, with the 365-day SMA at $72.17K and the Realized Price at $43.1K, reinforcing the strong profitability of holders. However, the current market structure suggests a decision point—either BTC finds support in the $ 90K-$97K range and prepares for another leg up, or further downside tests deeper support levels around $85K-$87K. Traders should closely monitor short-term holder behavior, as their realized price often dictates local trend shifts.
7. Correlation between USDT and USDC market caps and Bitcoin price.

Rising stablecoin market capitalization (USDT and USDC) typically correlates with increasing Bitcoin prices, indicating higher market liquidity and demand.
Conversely, declining stablecoin market capitalization often signals increased crypto selling and lower liquidity, potentially leading to Bitcoin price decreases.
USDT Daily Market Cap Change (in million USD) (3 Feb 2025 - 8 Feb 2025)
2025-02-03: +195.83M USD
2025-02-04: +970.60M USD
2025-02-05: +875.81M USD
2025-02-06: -212.41M USD
2025-02-07: +190.45M USD
2025-02-08: +306.52M USD
Net USDT Market Cap Change (3 Feb 2025 - 8 Feb 2025): +2.33B USD
Conclusion:
USDT saw a strong net increase of +2.33B USD over the past six days, with the most significant inflows occurring on February 4 and 5 (+970M and +875M, respectively). However, February 6 registered a notable outflow (-212M USD), indicating some degree of capital rotation or risk-off behavior. The last two days showed moderate inflows, suggesting that stablecoin liquidity is still entering the market.
Despite this strong inflow, Bitcoin’s price remains under $97K, signaling that this liquidity might not yet be fully deployed into BTC. If stablecoin inflows continue while BTC price stagnates, it could suggest capital is staying on the sidelines rather than flowing into risk assets.

USDC Daily Market Cap Change (in million USD) (3 Feb 2025 - 8 Feb 2025)
2025-02-03: +1.04B USD
2025-02-04: +588.32M USD
2025-02-05: +286.02M USD
2025-02-06: +428.84M USD
2025-02-07: +479.97M USD
2025-02-08: -181.35M USD
Net USDC Market Cap Change (3 Feb 2025 - 8 Feb 2025): +2.65B USD
Conclusion:
USDC added a net +2.65B USD over the last six days, continuing a trend of strong inflows, with the largest increase occurring on February 3 (+1.04B USD). However, the inflows gradually decelerated throughout the week, and on February 8, the first outflow (-181M USD) appeared, suggesting potential capital rotation or market hesitation.
Bitcoin’s price failed to react significantly to this liquidity surge, staying within the $96K-$99K range. This divergence suggests that either this capital remains on the sidelines, waiting for a more favorable entry, or it is being deployed into other crypto assets rather than BTC.
Combined Net Market Cap Change for USDT & USDC (3 Feb 2025 - 8 Feb 2025)
📊 Total Net Change: +4.98B USD
Key Takeaways:
USDC inflows were stronger than USDT, adding +2.65B USD, while USDT added +2.33B USD.
A large part of this stablecoin liquidity remains unallocated, as Bitcoin has not reacted with a major move.
USDC inflows peaked on Feb 3 (+1.04B USD) and USDT on Feb 4 (+970M USD), indicating that the strongest inflows may have already passed.
USDC saw its first negative day on Feb 8 (-181M USD), while USDT was stable, suggesting a possible slowing of capital injection into the market.
Bitcoin price remains flat despite large inflows, hinting at either institutional patience or capital moving into altcoins instead of BTC.
Market Implications:
Bullish: If this liquidity eventually gets deployed into BTC, we could see a new leg up in price.
Neutral: If inflows continue but BTC stays range-bound, it suggests capital remains on the sidelines, waiting for a clearer market signal.
Bearish: If outflows increase and inflows weaken, it could indicate a short-term top and potential market cooling.
Conclusion:
Stablecoin inflows have been significant, but Bitcoin has yet to capitalize on this liquidity surge. If USDC and USDT inflows slow down further, Bitcoin may struggle to break higher. However, if capital eventually gets deployed into BTC, it could serve as the next catalyst for an upward move. Traders should closely monitor USDT & USDC flows in the coming days for signs of whether liquidity is truly entering BTC or remaining sidelined.
8. Support the Newsletter: Exclusive Content & Perks.
Exclusive Content – Additional charts from premium platforms like CryptoQuant, Kingfisher, Santiment, and Intotheblock, available on request.
Telegram Subscribers' Group – Ask me any crypto-related questions directly.
Educational Content – Learn more about on-chain analysis.
Early Access – Get the newsletter immediately after it’s written, no waiting until 6 PM.
Enjoy a 5% discount coupon for an annual subscription below. Thank you to everyone supporting my work!
If you'd like to treat me to a virtual coffee or beer as a one-time gesture, you can do so through Suppi.
9. Newsletter Issue Summary:
Current Market Situation
📉 Crypto Sell-Off Deepens
BTC dips below $97K, failing to hold key support.
Altcoins suffer major losses – ETH down 14%, SOL and XRP hit hard.
Flight to Safety – Stablecoins show resilience, indicating risk-off sentiment.
🔍 Market Outlook: BTC must hold $96K-$97K to prevent deeper losses.
Coinbase Premium Index & ETF Analysis
📊 Institutional Buying Resumes
Coinbase Premium Index turns positive, suggesting renewed U.S. demand.
ETF net inflows remain strong, but GBTC outflows persist.
📌 Key Levels: BTC needs to reclaim $100K+ to confirm a bullish reversal.
Bitcoin’s Silent Network – A Warning or Just a Phase?
⚠️ Bitcoin Network Activity Hits a 1-Year Low
Transactions down 53%, mempool nearly empty.
RUNES protocol collapse → Fewer speculative transactions.
📊 Concern: BTC may be overvalued at $97K based on network fundamentals.
Bitcoin Profit Margins Turn Negative
📉 Short-Term Holders in Loss
BTC profit/loss margin briefly dipped below 0% – a critical shift.
Historically, this signals local bottoms or trend reversals.
📌 Key Watch: If margin stays negative, BTC could test $90K before rebounding.
Bitcoin at Key Support & Resistance Levels
📍 BTC Consolidates Around $97K
• $101K = Key resistance, $90K = Major support.
• Short-term holders near breakeven – Market reaction at these levels is crucial.
📉 Bearish case: BTC fails $97K → Tests $90K-$92K.
📈 Bullish case: BTC reclaims $101K → Next leg higher.
6. Stablecoin Inflows vs. BTC Price
💰 $4.98B in Stablecoin Inflows, but No BTC Breakout!
USDC: +2.65B USD | USDT: +2.33B USD.
Despite strong inflows, Bitcoin remains stuck under $97K.
📊 Key Question: Will this liquidity fuel a breakout or stay sidelined?
10. Forecast for the Upcoming Week:
Bitcoin Must Hold $96K-$97K – A breakdown could trigger lower support tests at $90K-$92K.
ETF Flows are Key – BlackRock & Fidelity continue accumulating, but GBTC outflows remain a drag.
Network Activity is Weak – Mempool congestion is at historic lows, suggesting low demand.
Stablecoin Liquidity Needs to Deploy – $4.98B in inflows hasn’t moved BTC. Will it fuel a breakout?
Short-Term Holders in Trouble – If profit margins remain negative, expect further sell pressure.
Stay alert and monitor key indicators for better market insights. Track upcoming US events for free using the Economic Calendar.

Remember to realize profits regularly.💡
This concludes this issue. I hope you have a pleasant end to your weekend and a great week ahead.
If you found this article helpful, leave a like 💙 comment and share it on your social media. 🤝
The next issue arrives next Sunday at 6 p.m. - check your inbox and SPAM folder!
This article reflects my personal views and is not investment advice. Cryptocurrency investments carry high risk. It includes mentions of WymienBitcoina.pl and affiliate links that may benefit the author.
Best regards
IT Tech